
Page 170 - Photoreactive Organic Thin Films
P. 170
149
40 60 10 15 20
(A) Temperature, °C Scattering Angle, 29, °
FIG. S.I Structural data for P8*H: (A) DSC traces on heating (/) and cooling (2); (B) X ray scatter-
ing profile below the phase transition (40°C).
This showed a single-phase transition with remarkable hysteresis: at 64°C on
heating but at 44°C on cooling. The transition was detected by various exper-
imental techniques including DSC, (see Figure 5.1A), X ray, and breadline
60 61
NMR. *
As seen in Figure 5.IB, the polymer forms a layered structure below the
transition point, showing a well-developed system of SAXS peaks. Moreover,
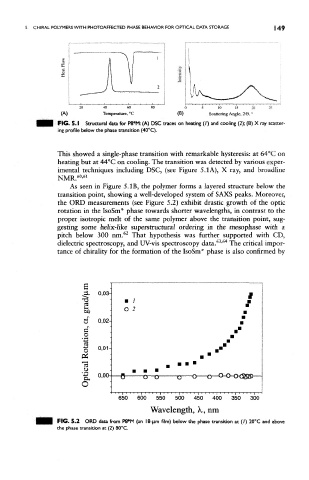
the ORD measurements (see Figure 5.2) exhibit drastic growth of the optic
rotation in the IsoSm* phase towards shorter wavelengths, in contrast to the
proper isotropic melt of the same polymer above the transition point, sug-
gesting some helix-like superstructural ordering in the mesophase with a
62
pitch below 300 nm. That hypothesis was further supported with CD,
63 64
dielectric spectroscopy, and UV-vis spectroscopy data. ' The critical impor-
tance of chirality for the formation of the IsoSm* phase is also confirmed by
a
±L 0,03-
1
wo O 2
0,02-
c
o
• 1— «
4->
03
•*— » 0,01-
O
-— a, 0,00- u
O
650 600 550 500 450 400 350 300
Wavelength, X, nm
FIG, 5.2 ORD data from P8*M (an 18-nm film) below the phase transition at (/) 20°C and above
the phase transition at (2) 80°C.