
Page 174 - Photoreactive Organic Thin Films
P. 174
5. CHIRAL POLYMERS WITH PHOTOAFFECTED PHASE BEHAVIOR FOR OPTICAL DATA STORAGE 153
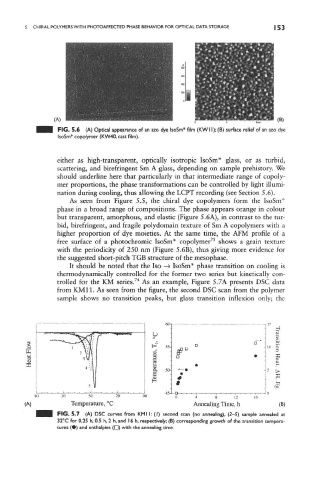
FIG. 5.6 (A) Optical appearance of an azo dye IsoSm* film (KWI I); (B) surface relief of an azo dye
IsoSm* copolymer (KW40, cast film).
either as high-transparent, optically isotropic IsoSm* glass, or as turbid,
scattering, and birefringent Sm A glass, depending on sample prehistory. We
should underline here that particularly in that intermediate range of copoly-
mer proportions, the phase transformations can be controlled by light illumi-
nation during cooling, thus allowing the LCPT recording (see Section 5.6).
As seen from Figure 5.5, the chiral dye copolymers form the IsoSm*
phase in a broad range of compositions. The phase appears orange in colour
but transparent, amorphous, and elastic (Figure 5.6A), in contrast to the tur-
bid, birefringent, and fragile polydomain texture of Sm A copolymers with a
higher proportion of dye moieties. At the same time, the AFM profile of a
75
free surface of a photochromic IsoSm* copolymer shows a grain texture
with the periodicity of 250 nm (Figure 5.6B), thus giving more evidence for
the suggested short-pitch TGB structure of the mesophase.
It should be noted that the Iso —> IsoSm* phase transition on cooling is
thermodynamically controlled for the former two series but kinetically con-
74
trolled for the KM series. As an example, Figure 5.7A presents DSC data
from KM11. As seen from the figure, the second DSC scan from the polymer
sample shows no transition peaks, but glass transition inflexion only; the
H
<D
2
u
Oi 50-
50 70 4 8 12
(A) Temperature, °C Annealing Time, h (B)
FIG. 5.7 (A) DSC curves from KM 11: (/) second scan (no annealing), (2-5) sample annealed at
32°C for 0.25 h, 0.5 h, 2 h, and 16 h, respectively; (B) corresponding growth of the transition tempera-
tures (•) and enthalpies (D) with the annealing time.