
Page 289 - Physical chemistry understanding our chemical world
P. 289
256 ACIDS AND BASES
−5
The value of K a for ethanoic acid is a hundred thousand times larger at 1.8 × 10 ,
−4
and K a for methanoic acid is ten times larger still, at 1.8 × 10 ; so methanoic acid
generates more solvated protons per mole of acid than either phenol or ethanoic acid.
We discover the relative differences in K a when walking in the country, for a nettle
can give a nasty sting (i.e. a chemical burn) but vinegar does not burn the skin. We
say methanoic acid is a stronger acid than ethanoic acid because its value of K a is
larger. A mole of phenol yields few protons, so we say it is a weak acid, because its
value of K a is tiny.
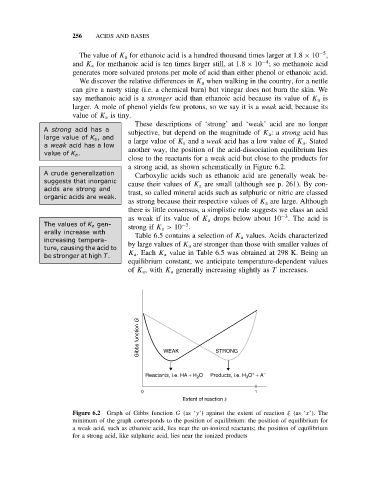
These descriptions of ‘strong’ and ‘weak’ acid are no longer
A strong acid has a subjective, but depend on the magnitude of K a :a strong acid has
large value of K a ,and
a large value of K a and a weak acid has a low value of K a . Stated
a weak acid has a low
value of K a . another way, the position of the acid-dissociation equilibrium lies
close to the reactants for a weak acid but close to the products for
a strong acid, as shown schematically in Figure 6.2.
A crude generalization Carboxylic acids such as ethanoic acid are generally weak be-
suggests that inorganic cause their values of K a are small (although see p. 261). By con-
acids are strong and trast, so called mineral acids such as sulphuric or nitric are classed
organic acids are weak.
as strong because their respective values of K a are large. Although
there is little consensus, a simplistic rule suggests we class an acid
−3
as weak if its value of K a drops below about 10 . The acid is
The values of K a gen- strong if K a > 10 .
−3
erally increase with Table 6.5 contains a selection of K a values. Acids characterized
increasing tempera- by large values of K a are stronger than those with smaller values of
ture, causing the acid to
be stronger at high T. K a . Each K a value in Table 6.5 was obtained at 298 K. Being an
equilibrium constant, we anticipate temperature-dependent values
of K a , with K a generally increasing slightly as T increases.
Gibbs function G WEAK STRONG
+
Reactants, i.e. HA + H 2 O Products, i.e. H 3 O + A −
0 1
Extent of reaction x
Figure 6.2 Graph of Gibbs function G (as ‘y’) against the extent of reaction ξ (as ‘x’). The
minimum of the graph corresponds to the position of equilibrium: the position of equilibrium for
a weak acid, such as ethanoic acid, lies near the un-ionized reactants; the position of equilibrium
for a strong acid, like sulphuric acid, lies near the ionized products