
Page 299 - Physical chemistry understanding our chemical world
P. 299
266 ACIDS AND BASES
1
The value of s when Ca(OH) reacts with HNO 3 will be , and the value when citric
2
2
3
acid reacts with Ca(OH) will be .
2
2
SAQ 6.12 What volume of Ca(OH) 2 (of concentration 0.20 mol dm −3 )
3
is required to neutralize 50 cm of nitric acid of concentration 0.10 mol
dm −3 ?
An alternative way of determining the endpoint of a titration
Sigmoidal literally is to monitor the pH during a titration, and plot a graph of pH
means ‘shaped like (as ‘y’) against volume V of alkali added (as ‘x’). Typically, the
a Greek sigma ς’. The concentration of the acid is unknown, but we know accurately the
name derives from the
Greek word sigmoides, concentration of alkali. Figure 6.3 shows such as graph – we call
meaning ‘sigma-like’. it a pH curve – in schematic form. The shape is sigmoidal, with
(There are two Greek the pH changing very rapidly at the end point.
letters called sigma, In practice, we obtain the end point by extrapolating the two
used differently in word linear regions of the pH curve (the extrapolants should be parallel).
construction. The other A third parallel line is drawn, positioned exactly midway between
has the shape σ.) the two extrapolants. The volume at which this third line crosses the
pH curve indicates the end point. Knowing the volume V (end point) ,
we can calculate the concentration of the acid via a calculation similar to Worked
Example 6.11.
Incidentally, the end point also represents the volume at which the pH changes most
dramatically, i.e. the steepest portion of the graph. For this reason, we occasionally
plot a different graph of gradient (as ‘y’) against volume V (as ‘x’); see Figure 6.4.
We obtain the gradient as ‘ pH ÷ V ’. The end point in Figure 6.4 relates to the
graph maximum.
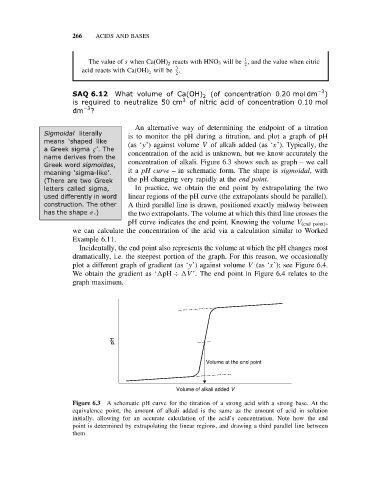
pH
Volume at the end point
Volume of alkali added V
Figure 6.3 A schematic pH curve for the titration of a strong acid with a strong base. At the
equivalence point, the amount of alkali added is the same as the amount of acid in solution
initially, allowing for an accurate calculation of the acid’s concentration. Note how the end
point is determined by extrapolating the linear regions, and drawing a third parallel line between
them