
Page 219 - Pipeline Risk Management Manual Ideas, Techniques, and Resources
P. 219
8/196 Data Management and Analyses
Sensitivity analysis in the corrosion index translates to some percentage reduction
in risk of that type of failure. This improvement could he
The overall algorithm that underlies a risk model must react achieved through changes in a risk activity or condition such as
appropriately-neither too much nor too little-to changes in in-line inspection, close-interval surveys, or coating condition
any and all variables. In the absence of reliable data, this appro- or through some combination of changes in multiple variables.
priate reaction is gauged to a large extent by expertjudgment as Similarly, a change in the consequences (the leak impactfactol;
to how the real-world risk is really impacted by a variable LIF) correlates to the same corresponding change in the overall
change. risk score.
Sensitivity analysis generally refers to an evaluation of the Some variables such as pressure and population density
relative change in results due to a change in inputs-the sensi- impact both the probability and consequence sides of the risk
tivity of outputs to changes in inputs. Sensitivity analysis can be algorithm. In these cases, the impact is not obvious.
a very statistically rigorous process if advanced techniques A spreadsheet can be developed to allow "what-if'' compar-
such as ANOVA (analysis of variance), factorial design, or isons and sensitivity analyses for specific changes in risk vari-
other statistical design of experiments techniques are used to ables. An example of such comparisons for a specific risk
quantify the influence of specific variables. However, some model is shown in Table 8.3. The last column of this table indi-
simple mathematical and logical techniques can alternatively cates the impact of the change shown in the first column. For
be used to gauge the impact on results caused by changing cer- instance, the first row shows that this risk model predicts a 10%
tain inputs. Some of the previously discussed graphical tools overall risk reduction for each 10% increase in pipe wall thick-
can be useful here. For example, a correlation chart can help ness, presumably in a linearly proportional fashion. (Note that
verify expected relationships among variables or alert the ana- any corrosion-related benefit from increased wall thickness is
lyst to possible model weaknesses when expectations are not not captured in this model since corrosion survivability is not
realized. being considered.)
From the mathematical formula behind the risk algorithm Table 8.3 reflects changes from a specific set of variables
presented in Chapters 3 through 7, the effect of changes on any that represent a specific risk situation along the pipeline.
risk variable can be readily seen. Any percentage change in an Results for different sets of variables might be different. This
index value represents a change in the probability of failure and type of"what-if" scenario generation also serves as a riskman-
hence, the overall risk. For example, an increase (improvement) agement tool.
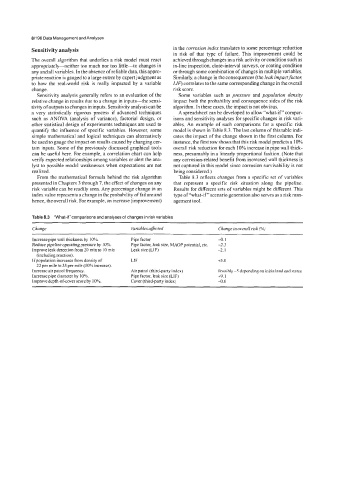
Table 8.3 "What-if" comparisons and analyses of changes in risk variables
Change Variables affected Change in overall risk (5%)
Increase pipe wall thickness by 10%. Pipe factor -0. I
Reduce pipeline operating pressure by 10%. Pipe factor, leak size, MAOPpotential, etc. -2.3
Improve leak detection from 20 min to 10 min Leak size (LIF) -2.1
(including reaction).
If population increases from density of LIF +5.0
22 per mile to 33 per mile (50% increase).
Increase air patrol frequency. Air patrol (third-party index) Possibly -5 depending on initial and end states
Increase pipe diameter by 10%. Pipe factor, leak size (LIF) +9.1
Improve depth-of-cover score by 10%. Cover (third-party index) -0.6