
Page 222 - Pipeline Risk Management Manual Ideas, Techniques, and Resources
P. 222
Stress and human errors 9/199
mitigation systems and lead to increased chances of human these indicators are selected partly because they are quantifi-
error. A higher negative stress level leading to a shortened able measures, the data are not always readily available. In the
attention span can subvert many of the items in the incorrect absence of such data, it is suggested that no point adjustments
operations index. Training, use of procedures, inspections, be made. Where indications exist, a relative point or percentage
checklists, etc., all depend on the individual dedicating atten- adjustment scale for the incorrect operations index can be set
tion to the activity. All loss of focus will reduce effectiveness. It up as shown inTable 9.1, In this example table, a previously cal-
will be nearly impossible to accurately assess the stress level culated Incorrect Operations index score would be reduced by
during times of design and construction of older pipelines. up to 20 points or 25% when significant indicators of negative
Therefore, the assessments will generally apply to human error stress exist.
potential for operations and maintenance activities of existing There is also the possibility that a workforce has unusually
pipelines and all aspects of planned pipelines. low stress levels, presumably leading to a low error rate.
Stress levels can, of course, impact the potential of other fail- Indications of lower stress levels might be
ure modes, as can many aspects of the incorrecf operations
index. As a modeling convenience and consistent with the use Category I Positive Indicators
of the incorrect operations index, only that index is adjusted by Low accident rate
the human stress issue in this example risk model. Low rate of errors
Indications of higher stress andor distraction levels can be
identified and prioritized. The following list groups indicators
into three categories, arranged in priority order. The first cate- Category II Positive Indicators
gories provide more compelling evidence of a potentially Low substance abuse
higher future error rate: 0 Low absenteeism
Low rate of disciplinary actions
Category INegative Indicators
High current accident rate
High current rate of errors Category Ill Positive Indicators
High motivation, general satisfaction
Strong sense of teamwork and cooperation
Category II Negative Indicators Much positive feedback in employee surveys or interviews
High substance abuse Low employee turnover
High absenteeism High degree of control and autonomy among most
High rate of disciplinary actions employees
High participation in suggestion systems.
Category Ill Negative Indicators As with the negative indicators, comparative data will be
Low motivation, general dissatisfaction, required and opinions should be only very carefully used. For
0 Low teamwork and cooperation (evidence of conspiracies, instance, a low incidence of substance abuse should only war-
unhealthy competition, “politics”) rant points if this was an unusual condition for this type of work
Much negativity in employee surveys or interviews group in this culture. Where indications exist, arelative point or
High employee turnover percentage adjustment scale for the incorrect operations index
Low degree of control and autonomy among most employees can be set up as shown inTable 9.2.
Low (or very negative) participation in suggestion systems. In the examples given in Tables 9.1 and 9.2, the results of the
stress/distraction analysis would he as follows: When one or
Interpreting these signs is best done in the context of histori- more of the indicators shows clear warning signals, the evalua-
cal data collected from the workplace being evaluated and other tor can reduce the overall incorrect operations index score by
similar workplaces. The adjective high is, of course, relative. up to 20 points or 25%. When these signs are reversed and
The evaluator will need some comparative measures, either clearly show a better work environment than other similar oper-
from other work groups within the company or from published ations, up to 20 points or 25% can be added to the incorrect
industry-wide or country-wide data, or perhaps even from operations index. These are intended only to capture unusual
experience in similar evaluations. Care should be exercised in situations. Points should be added or deducted only when
accepting random opinions for these items. Although most of strong indications of a unique situation are present.
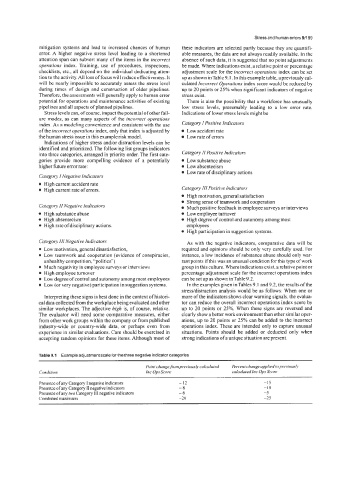
Table 9.1 Example adjustment scale for the three negative indicator categories
Point change fmrnpreviously calculated Percent change applied toprevroush
Condition Inc Ops Score calculated Inc Ops Score
Presence ofany Category I negative indicators - 12 -1s
Presence of any Category I1 negative indicators -8 -10
Presence ofany two Category I11 negative indicators -6 -5
Combined maximum -20 -2s