
Page 217 - Pipeline Risk Management Manual Ideas, Techniques, and Resources
P. 217
81194 Data Management and Analyses
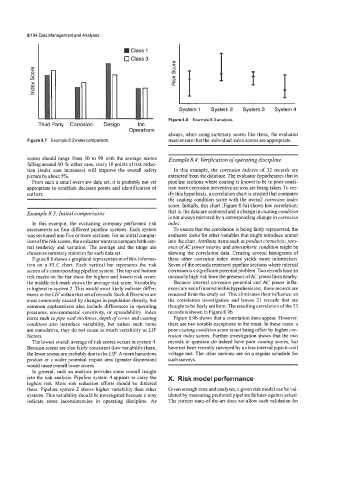
Class 1
0 Class 3
System 1 System 2 System 3 System 4
Figure 8.8 Example 8.3 analysis
Third Party Corrosion Design Inc.
Operations
always, when using summary scores like these, the evaluator
Figure 8.7 Example 8.2 index comparison must ensure that the individual index scores are appropriate.
scores should range from 30 to 90 with the average scores Example 8.4: Verification of operating discipline
falling around 60. In either case, every 10 points of risk reduc-
tion (index sum increases) will improve the overall safety In this example, the corrosion indexes of 32 records are
picture by about 5%. extracted from the database. The evaluator hypothesizes that in
From such a small overview data set, it is probably not yet pipeline sections where coating is known to be in poor condi-
appropriate to establish decision points and identification of tion more corrosion preventive actions are being taken. To ver-
outliers. ify this hypothesis, a correlation chart is created that compares
the coating condition score with the overall corrosion index
score. Initially, this chart (Figure 8.9a) shows low correlation;
Example 8.3: Initial comparisons that is, the data are scattered and a change in coating condition
is not always mirrored by a corresponding change in corrosion
In this example, the evaluating company performed risk index.
assessments on four different pipeline systems. Each system To ensure that the correlation is being fairly represented, the
was sectioned into five or more sections. For an initial compar- evaluator looks for other variables that might introduce scatter
ison ofthe risk scores, the evaluator wants to compare both cen- into the chart. Attribute items such asproduct corrosivi@, pres-
tral tendency and variation. The average and the range are ence ofACpower nearby, and atmospheric condition might be
chosen as summary statistics for each data set. skewing the correlation data. Creating several histograms of
Figure 8.8 shows a graphical representation of this informa- these other corrosion index items yields more information.
tion on a HLC chart. Each vertical bar represents the risk Seven of the records represent pipeline sections where internal
scores of a corresponding pipeline system. The top and bottom corrosion is a significant potential problem. Two records have an
tick marks on the bar show the highest and lowest risk score; unusually high risk from the presence ofAC power lines nearby.
the middle tick mark shows the average risk score. Variability Because internal corrosion potential and AC power influ-
is highest in system 2. This would most likely indicate differ- ences are not of interest in this hypothesis test, these records are
ences in the LIFwithin that set of records. Such differences are removed from the study set. This eliminates their influence on
most commonly caused by changes in population density, but the correlation investigation and leaves 23 records that are
common explanations also include differences in operating thought to be fairly uniform. The resulting correlation of the 23
pressures, environmental sensitivity, or spreadability. Index records is shown in Figure 8.9b.
items such as pipe wall thickness, depth of cover, and coating Figure 8.9b shows that a correlation does appear. However,
condition also introduce variability, but unless such items there are two notable exceptions to the trend. In these cases, a
are cumulative, they do not cause as much variability as LIF poor coating condition score is not being offset by higher cor-
factors. rosion index scores. Further investigation shows that the two
The lowest overall average of risk scores occurs in system 4. records in question do indeed have poor coating scores, but
Because scores are also fairly consistent (low variability) here, have not been recently surveyed by a close interval pipe-to-soil
the lower scores are probably due to the LIF. A more hazardous voltage test. The other sections are on a regular schedule for
product or a wider potential impact area (greater dispersion) such surveys.
would cause overall lower scores.
In general, such an analysis provides some overall insight
into the risk analysis. Pipeline system 4 appears to carry the X. Risk model performance
highest risk. More risk reduction efforts should be directed
there. Pipeline system 2 shows higher variability than other Given enough time and analyses, a given risk model can be val-
systems. This variability should be investigated because it may idated by measuring predicted pipeline failures against actual.
indicate some inconsistencies in operating discipline. As The current state-of-the-art does not allow such validation for