
Page 218 - Pipeline Risk Management Manual Ideas, Techniques, and Resources
P. 218
Risk model performance 81195
=I
W
u
n -
C
._
ul
2
L
0
0
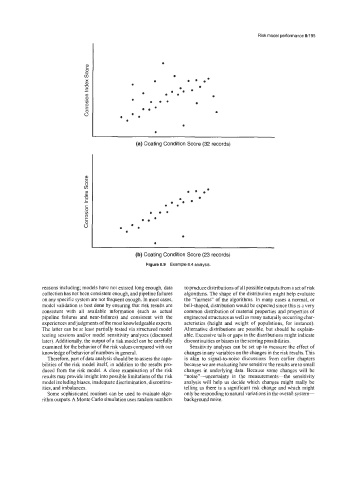
(a) Coating Condition Score (32 records)
(b) Coating Condition Score (23 records)
Figure 8.9 Example 8.4 analysis.
reasons including; models have not existed long enough, data to produce distributions ofall possible outputs from a set of risk
collection has not been consistent enough, and pipeline failures algorithms. The shape of the distribution might help evaluate
on any specific system are not frequent enough. In most cases, the “fairness” of the algorithms. In many cases a normal, or
model validation is best done by ensuring that risk results are bell-shaped, distribution would be expected since this is a very
consistent with all available information (such as actual common distribution of material properties and properties of
pipeline failures and near-failures) and consistent with the engineered structures as well as many naturally occurring char-
experiences and judgments of the most knowledgeable experts. acteristics (height and weight of populations, for instance).
The latter can be at least partially tested via structured model Alternative distributions are possible, but should be explain-
testing sessions andor model sensitivity analyses (discussed able. Excessive tails or gaps in the distributions might indicate
later). Additionally, the output of a risk model can be carehlly discontinuities or biases in the scoring possibilities.
examined for the behavior ofthe risk values compared with our Sensitivity analyses can be set up to measure the effect of
knowledge of behavior of numbers in general. changes in any variables on the changes in the risk results. This
Therefore, part of data analysis should be to assess the capa- is akin to signal-to-noise discussions from earlier chapters
bilities of the risk model itself, in addition to the results pro- because we are evaluating how sensitive the results are to small
duced from the risk model. A close examination of the risk changes in underlying data. Because some changes will be
results may provide insight into possible limitations of the risk “noise”-uncertainty in the measurements-the sensitivity
model including biases, inadequate discrimination, discontinu- analysis will help us decide which changes might really be
ities, and imbalances. telling us there is a significant risk change and which might
Some sophisticated routines can be used to evaluate algo- only be responding to natural variations in the overall system-
rithm outputs. A Monte Carlo simulation uses random numbers background noise.