
Page 514 - Pipelines and Risers
P. 514
LCC ModeIing as a Decision Making Tool in Pipeline Design 48 1
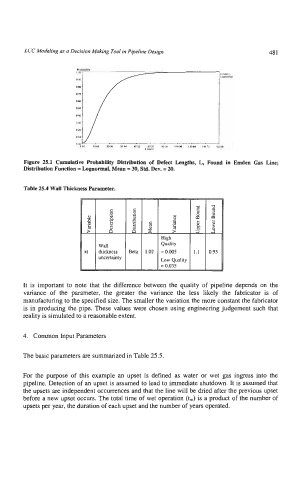
Figure 25.1 Cumulative Probability Mstribution of Defect Lengths, L, Found in Emden Gas Line;
Distribution Function = Lognormal, Mean = 30, Std. Dev. = 20.
Table 25.4 Wall Thickness Parameter.
It is important to note that the difference between the quality of pipeline depends on the
variance of the parameter, the greater the variance the less likely the fabricator is of
manufacturing to the specified size. The smaller the variation the more constant the fabricator
is in producing the pipe. These values were chosen using engineering judgement such that
reality is simulated to a reasonable extent.
4. Common Input Parameters
The basic parameters are summarized in Table 25.5.
For the purpose of this example an upset is defined as water or wet gas ingress into the
pipeline. Detection of an upset is assumed to lead to immediate shutdown. It is assumed that
the upsets are independent Occurrences and that the line will be dried after the previous upset
before a new upset occurs. The total time of wet operation (tw) is a product of the number of
upsets per year, the duration of each upset and the number of years operated.