
Page 515 - Pipelines and Risers
P. 515
482 Chapter 25
Table 25.5 Summary of Common Input Parameters.
Distribution I Basicvalue 11
Comment
CR Comion rate, Constant II
mmlvr.
X, Model Mean: 1.5
uncertainty Std. dev.: 0.5
U Number of Mean: 3
upsets per year Std. dev.: 2
t (single Duration of wet
upset) line operation, Std. dev.: 2
single upset,
davs
L Length of defect, Lognormal Mean: 30
mm
Std. dev.: 20
wt Wall thiclmess Constant 15.9
Internal diameter Constant 425.2 mm
25.5.8 Step 6- Reliability Analysis
Through the use of SYSREL, a reliability analysis program, it was possible to determine the
cumulative failure probability of each year of operation. The annual failure probability was
found using the equation give below.
Pr(n)=CPt(n)-CPr(n- 1) (25.17)
where:
PF Annual Probability of Failure
CPFCumulative Probability of Failure
n = Year
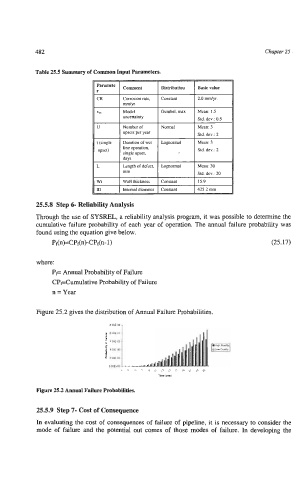
Figure 25.2 gives the distribution of Annual Failure Probabilities.
2 WE-o3 1
Figure 25.2 Annual Failure Probabilities.
25.5.9 Step 7- Cost of Consequence
In evaluating the cost of consequences of failure of pipeline, it is necessary to consider the
mode of failure and the potential out comes of those modes of failure. In developing the