
Page 213 - Plant design and economics for chemical engineers
P. 213
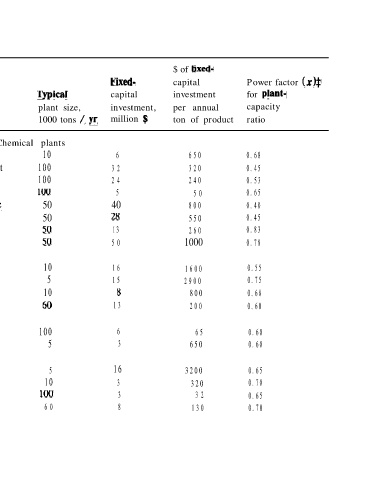
TABLE 19
 Capital-cost data for processing plants (i990)t
                            $ of fixed-
                  Fiied-    capital     Power factor (x)$
 PKUdUCt  ljpical  capital  investment  for  plant-
 Or    plant size,  investment,  per annual  capacity
 Pro==  Process remarks  1000 tons  / yr  million  .$  ton of product  ratio

 Chemical plants
 Acetic acid  CHsOH  and  CO-catalytic  10  6  650  0.68
 Acetone  Propylene-copper  chloride  catalyst  100  3 2  320  0.45
 Ammonia  Steam reforming  100  2 4  240  0.53
 Ammonium nitrate  Ammonia and nitric acid  100  5  5 0  0.65
 Butanof  Propylene, CO, and  H,O-catalytic  50  40  800  0.40
 Chlorine  Electrolysis of  NaCl  50  28  550  0.45
 Ethylene  Refinery  gases  50  13  260  0.83
 Ethylene oxide  Ethylene-catalytic  50  5 0  1000  0.78
 Formaldehyde
 (37%)  Methanol-catalytic  10  16  1600  0.55
 Glycol  Ethylene and chlorine  5  15  2900  0.75
 Hydrofluoric  acid  Hydrogen fluoride and  H,O  10  8  800  0.68
 Methanol  CO,, natural gas, and steam  60  13  200  0.60
 Nitric acid
 (high strength)  Ammonia-catalytic  100  6  65  0.60
 Phosphoric acid  Calcium phosphate and  H,SO,  5  3  650  0.60
 Polyethylene
 (high density)  Ethylene-catalytic  5  16  3200  0.65
 Propylene  Refinery  gases  10  3  320  0.70
 Sulfuric acid  Sulfur-catalytic  100  3  3 2  0.65
 Urea  Ammonia and CO,  6 0  8  130     0.70