
Page 214 - Plant design and economics for chemical engineers
P. 214
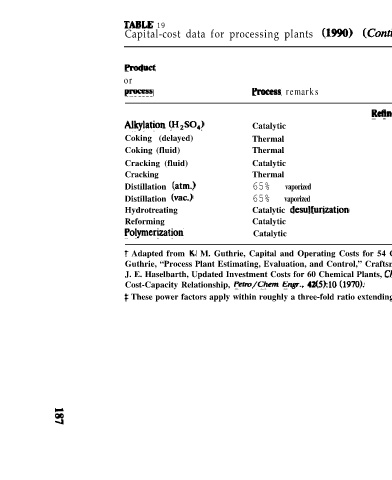
TABLE  19
                     Capital-cost data for processing plants @!90)  (Continued)
                                                                            Fixed-   sofn!ted-  Power  factor  (x)s
                     ROdUCi                                      Typical    =Pm      Crrpitd   for  plant-
                     or                                          plant  size,  investmenf  investment  =padty
                     P-s                 Pmcess  remarks         lOOObbI/day   miMon$  per  bbl  /  day  ratio
                                                           ReRnmyunits
                     Alkylation   (H,SO,)  Catalytic              10        19       1900      0.60
                     Coking (delayed)    Thermal                  10        26       2600      0.38
                     Coking (fluid)      Thermal                  10        16       MOO       0.42
                     Cracking (fluid)    Catalytic                10        16       1600      0.70
                     Cracking            Thermal                  10         5        500      0.70
                     Distillation  (atm.)  65%   vaporized       100        32        3m       0.90
                     Distillation  fvac.)  65%  vaporized        100        19        200      0.70
                     Hydrotreating       Catalytic  desulfitrization  10     3        320      0.65
                     Reforming           Catalytic                10        29                 0.60
                     Polytnerization     Catalytic                10         5                 0.58
                     t Adapted from  K.  M. Guthrie, Capital and Operating Costs for 54 Chemical Processes, Chem.  Eng..  11(13):140  f.June  15, 1970) and K. M.
                     Guthrie, “Process Plant Estimating, Evaluation, and Control,” Craftsman Book  Company of America, Solana  Beach, California. 1974. See also
                     J. E. Haselbarth, Updated Investment Costs for 60 Chemical Plants, C/rem.  Eng.,  74(25):214 (Dec.  4,  1967)  and D. Drayer, How to Estimate Plant
                     Cost-Capacity Relationship,  Perru/Chem  Engr.,   42(5):10 (1970).
                     $ These power factors apply within roughly a three-fold ratio extending either way from the plant size as given.