
Page 165 - Plastics Engineering
P. 165
148 Mechanical Behaviour of Plastics
test data and product performance and (b) between test results from different
laboratories. The first of these problems is the more serious because it can raise
doubts in the mind of the designer about the use of plastics.
Fortunately the situation in practice is not quite as complex as it might seem.
In general, very acceptable designs are achieved by using impact data obtained
under conditions which relate as closely as possible to the service conditions.
Impact strength values available in the literature may be used for the initial
selection of a material on the basis of a desired level of toughness. Then,
wherever possible this should be backed up by tests on the plastic article, or a
specimen cut from it, to ensure that the material, as moulded, is in a satisfactory
state to perform its function.
As always, of course, to alleviate fracture problems it is essential to avoid the
factors which are likely to cause brittleness. These include stress concentrations
and low temperatures and the effects of these will be considered in the following
sections.
2.22.1 Effect of Stress Concentrations
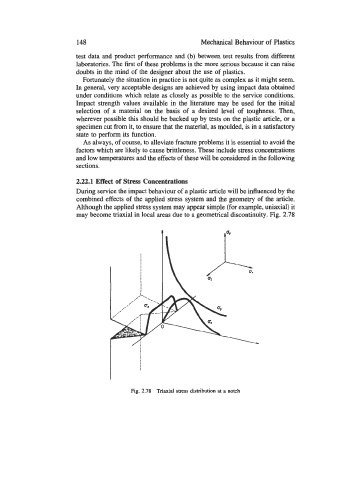
During service the impact behaviour of a plastic article will be influenced by the
combined effects of the applied stress system and the geometry of the article.
Although the applied stress system may appear simple (for example, uniaxial) it
may become triaxial in local areas due to a geometrical discontinuity. Fig. 2.78
i
Fig. 2.78 Triaxial stress distribution at a notch