
Page 288 - Power Electronic Control in Electrical Systems
P. 288
//SYS21/F:/PEC/REVISES_10-11-01/075065126-CH007.3D ± 276 ± [263±289/27] 17.11.2001 10:25AM
276 Harmonic studies of power compensating plant
and
0 1 0 10 1
V 1 1 1 0 V A
30
V 2 V B
@ A p @ 0 1 1 A@ A (7:35)
3
V 3 1 0 1 V C
Premultiplying equation (7.33) by the matrix term of equation (7.34), suitably modi-
fied to account for the higher order dimensions associated with the harmonic
problem, and substituting equation (7.35) into the intermediate result, the following
solution is arrived at
0 1 0 10 1
I R,A H 1 H 2 H 2 H 1 V A
1
I R,B H 2 H 2 H 3 H 3 V B
@ A @ A@ A (7:36)
3
I R,C H 1 H 3 H 3 H 1 V C
7.4.3.1 Numerical example 2
The three-phase TCR harmonic model is used to calculate the harmonic currents drawn
by a TCR installed in a 400 kVsubstation. The static compensator draws a net 35 10%
MVAr inductive at the tertiary terminal of a 240 MVA, 400/230/33 kV autotransformer.
The network is assumed to have 2% negative sequence voltage unbalance and the
average system frequency is taken to be 50 Hz. The three-phase fault level at the
400 kVside is 11 185 MVA, while that on the 230 kVside is 6465 MVA. The short-
circuit parameters of the transformer are 12.5%, 81.2% and 66.3% for the HV/MV,
HV/LVand MV/LVsides, respectively. The TCR inductance per phase is L 90 mH.
Norton equivalent representations that vary linearly with frequency are used for
both the 400 kVnetwork and the 230 kVnetwork, A T-representation is used for the
three-winding transformer. The linear Norton equivalents and the transformer
admittances are combined with the harmonic domain admittance of the TCR. The
overall representation is a nodal admittance matrix that contains information for the
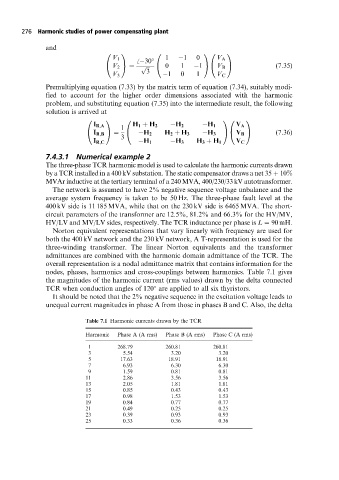
nodes, phases, harmonics and cross-couplings between harmonics. Table 7.1 gives
the magnitudes of the harmonic current (rms values) drawn by the delta connected
TCR when conduction angles of 120 are applied to all six thyristors.
It should be noted that the 2% negative sequence in the excitation voltage leads to
unequal current magnitudes in phase A from those in phases B and C. Also, the delta
Table 7.1 Harmonic currents drawn by the TCR
Harmonic Phase A (A rms) Phase B (A rms) Phase C (A rms)
1 268.79 260.81 260.81
3 5.54 3.20 3.20
5 17.63 18.91 18.91
7 6.93 6.30 6.30
9 1.59 0.81 0.81
11 2.86 3.56 3.56
13 2.05 1.81 1.81
15 0.85 0.43 0.43
17 0.98 1.53 1.53
19 0.84 0.77 0.77
21 0.49 0.25 0.25
23 0.39 0.93 0.93
25 0.33 0.36 0.36