
Page 290 - Power Electronic Control in Electrical Systems
P. 290
//SYS21/F:/PEC/REVISES_10-11-01/075065126-CH007.3D ± 278 ± [263±289/27] 17.11.2001 10:25AM
278 Harmonic studies of power compensating plant
Frequency response at Tiwai
1.2 1
Impedance magnitude (p.u.) 0.8
0.6
0.4
0.2
0
100
0 100 200 300 400 500 600 700 800
Frequency (H )
z
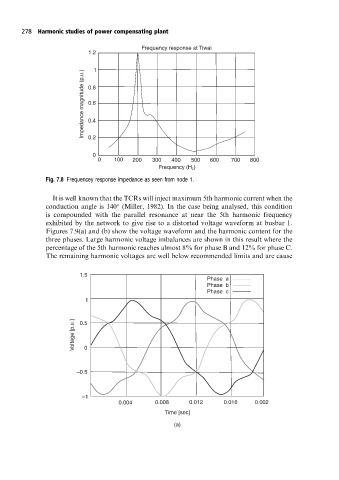
Fig. 7.8 Frequencey response impedance as seen from node 1.
It is well known that the TCRs will inject maximum 5th harmonic current when the
conduction angle is 140 (Miller, 1982). In the case being analysed, this condition
is compounded with the parallel resonance at near the 5th harmonic frequency
exhibited by the network to give rise to a distorted voltage waveform at busbar 1.
Figures 7.9(a) and (b) show the voltage waveform and the harmonic content for the
three phases. Large harmonic voltage imbalances are shown in this result where the
percentage of the 5th harmonic reaches almost 8% for phase B and 12% for phase C.
The remaining harmonic voltages are well below recommended limits and are cause
1.5
Phase a
Phase b
Phase c
1
[p.u.] 0.5
Voltage 0
–0.5
–1
0.004 0.008 0.012 0.016 0.002
Time [sec]
(a)