Page 294 - Power Electronic Control in Electrical Systems
P. 294

//SYS21/F:/PEC/REVISES_10-11-01/075065126-CH007.3D ± 282 ± [263±289/27] 17.11.2001 10:25AM


               282 Harmonic studies of power compensating plant

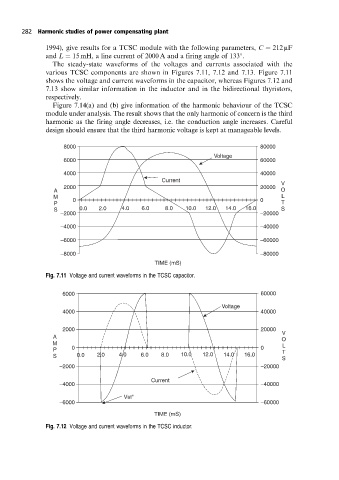
                      1994), give results for a TCSC module with the following parameters, C ˆ 212 mF
                      and L ˆ 15 mH, a line current of 2000 A and a firing angle of 133 .

                        The steady-state waveforms of the voltages and currents associated with the
                      various TCSC components are shown in Figures 7.11, 7.12 and 7.13. Figure 7.11
                      shows the voltage and current waveforms in the capacitor, whereas Figures 7.12 and
                      7.13 show similar information in the inductor and in the bidirectional thyristors,
                      respectively.
                        Figure 7.14(a) and (b) give information of the harmonic behaviour of the TCSC
                      module under analysis. The result shows that the only harmonic of concern is the third
                      harmonic as the firing angle decreases, i.e. the conduction angle increases. Careful
                      design should ensure that the third harmonic voltage is kept at manageable levels.

                           8000                                                     80000
                                                                      Voltage
                           6000                                                     60000

                           4000                                                     40000
                                                       Current                            V
                           2000                                                     20000
                        A                                                                 O
                        M    0                                                      0     L
                        P                                                                 T
                                                                      .
                                            .
                                      .
                        S      0.0   2 0    4 0  6. 0   8. 0  10.0  12 0  14.0  16.0      S
                          –2000                                                     –20000
                          –4000                                                     –40000
                          –6000                                                     –60000
                          –8000                                                     –80000
                                                     TIME (mS)
                      Fig. 7.11 Voltage and current waveforms in the TCSC capacitor.


                          6000                                                      60000
                                                                         Voltage
                          4000                                                      40000

                          2000                                                      20000
                                                                                          V
                        A                                                                 O
                        M                                                                 L
                        P    0                                                      0     T
                        S      0.0  2.0    4.0   6.0   8.0   10.0  12.0  14.0  16.0
                                                                                          S
                          –2000                                                     –20000
                                                    Current
                          –4000                                                     –40000
                                            Vst"
                          –6000                                                     –60000
                                                     TIME (mS)

                      Fig. 7.12 Voltage and current waveforms in the TCSC inductor.
   289   290   291   292   293   294   295   296   297   298   299