
Page 98 - Power Electronic Control in Electrical Systems
P. 98
//SYS21/F:/PEC/REVISES_10-11-01/075065126-CH003.3D ± 86 ± [82±105/24] 17.11.2001 9:53AM
86 Transmission system compensation
3.2.2 Surge impedance and natural loading of a transmission
line
The surge impedance is the driving-point impedance of an infinitely long line, or a
line which is terminated in a load impedance Z 0 such that V r Z 0 I r . In either case, at
a point x along the line, the ratio between the voltage V(x) and the current I(x)is
given by equations (3.2) as
V(x) Z 0 I r [ cos b(a x) j sin b(a x)]
Z
x Z 0 (3:3)
I(x) I r [ cos b(a x) j sin b(a x)]
which is not only independent of x but is real and equal to Z 0 . This means that V and
I are in phase at all points along the line. However, the phase angles of both phasors
vary linearly along the line since
V(x) V r e jb(a x) and I(x) I r e jb(a x) (3:4)
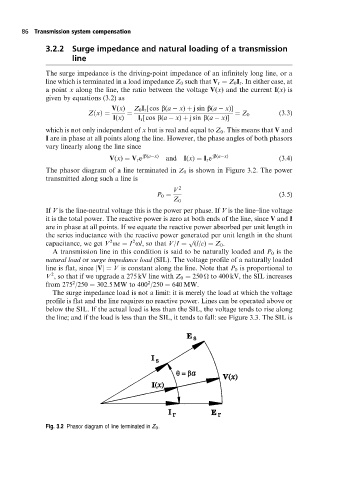
The phasor diagram of a line terminated in Z 0 is shown in Figure 3.2. The power
transmitted along such a line is
V 2
P 0 (3:5)
Z 0
If V is the line-neutral voltage this is the power per phase. If V is the line±line voltage
it is the total power. The reactive power is zero at both ends of the line, since V and I
are in phase at all points. If we equate the reactive power absorbed per unit length in
the series inductance with the reactive power generated per unit length in the shunt
2 2 p
capacitance, we get V oc I ol, so that V/I (l/c) Z 0 .
A transmission line in this condition is said to be naturally loaded and P 0 is the
natural load or surge impedance load (SIL). The voltage profile of a naturally loaded
line is flat, since jVj V is constant along the line. Note that P 0 is proportional to
2
V , so that if we upgrade a 275 kV line with Z 0 250
to 400 kV, the SIL increases
2
2
from 275 /250 302:5 MW to 400 /250 640 MW.
The surge impedance load is not a limit: it is merely the load at which the voltage
profile is flat and the line requires no reactive power. Lines can be operated above or
below the SIL. If the actual load is less than the SIL, the voltage tends to rise along
the line; and if the load is less than the SIL, it tends to fall: see Figure 3.3. The SIL is
Fig. 3.2 Phasor diagram of line terminated in Z 0 .