
Page 322 - Power Electronics Handbook
P. 322
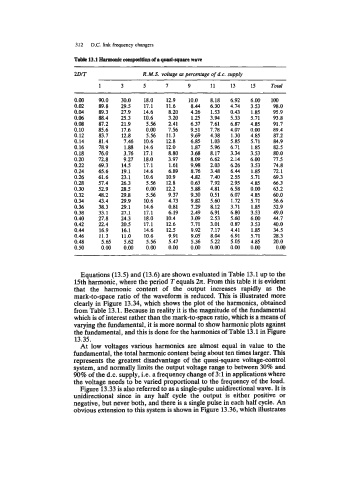
312   D.C. link frequency changers

                        Tsbk 13.1 Hamonk eompositiop of s quad-qusre rsve
                        2DIT                R. M.S. voltage   percentage of d.c. supply

                               1      3     5      7      9      11    13    15    Total
                        0.00   90.0   30.0   18.0   12.9   10.0   8.18   6.92   6.00   100
                        0.02   89.8   29.5   17.1   11.6   8.44   6.30   4.74   3.53   98.0
                        0.04   89.3   27.9   14.6   8.20   4.26   1.53   0.43   1.85   95.9
                        0.06   88.4   25.3   10.6   3.20   1.25   3.94   5.33   5.71   93.8
                        0.08   87.2   21.9   5.56   2.41   6.37   7.61   6.87   4.85   91.7
                        0.10   85.6   17.6   0.00   7.56   9.51   7.78   4.07   0.00   89.4
                        0.12   83.7   12.8   5.56   11.3   9.69   4.38   1.30   4.85   87.2
                        0.14   81.4    7.46   10.6   12.8   6.85   1.03   5.85   5.71   84.9
                        0.16   78.9    1.88   14.6   12.0   1.87   5.96   6.71   1.85   82.5
                        0.18   76.0   3.76   17.1   8.80   3.68   8.17   3.34   3.53   80.0
                        0.20   72.8   9.27   18.0   3.97   8.09   6.62   2.14   6.00   77.5
                        0.22   69.3   14.5   17.1   1.61   9.98   2.03   6.26   3.53   74.8
                        0.24   65.6   19.1   14.6   6.89   8.76   3.48   6.44   1.85   72.1
                        0.26   61.6   23.1   10.6   10.9   4.82   7.40   2.55   5.71   69.3
                        0.28   57.4   26.3   5.56   12.8   0.63   7.92   2.95   4.85   66.3
                        0.30   52.9   28.5   0.00   12.2   5.88   4.81   6.58   0.00   63.2
                        0.32   48.2   29.8   5.56   9.37   9.30   0.51   6.07   4.85   60.0
                        0.34   43.4   29.9   10.6   4.73   9.82   5.60   1.72   5.71   56.6
                        0.36   38.3   29.1   14.6   0.81   7.29   8.12   3.71   1.85   52.9
                        0.38   33.1   27.1   17.1   6.19   2.49   6.91   6.80   3.53   49.0
                        0.40   27.8   24.3   18.0   10.4   3.09   2.53   5.60   6.00   44.7
                        0.42   22.4   20.5   17.1   12.6   7.71   3.01   0.87   3.53   40.0
                        0.44   16.9   16.1   14.6   12.5   9.92   7.17   4.41   1.85   34.5
                        0.46   11.3   11.0   10.6   9.91   9.05   8.04   6.91   5.71   28.3
                        0.48    5.65   5.62   5.56   5.47   5.36   5.22   5.05   4.85   20.0
                        0.50    0.00   0.00   0.00   0.00   0.00   0.00   0.00   0.00   0.00


                         Equations (13.5) and (13.6) are shown evaluated in Table 13.1 up to the
                        15th harmonic, where the period T equals a. From this table it is evident
                       that  the  harmonic  content  of  the  output  increases  rapidly  as  the
                        mark-to-space ratio of  the waveform is reduced. This is illustrated more
                       clearly in Figure 13.34, which shows the plot of  the harmonics, obtained
                       from Table 13.1. Because in reality it is the magnitude of the fundamental
                       which is of interest rather than the mark-to-space ratio, which is a means of
                       varying the fundamental, it is more normal to show harmonic plots against
                       the fundamental, and this is done for the harmonics of Table 13.1 in Figure
                        13.35.
                         At  low  voltages various  harmonics are  almost  equal  in  value  to the
                       fundamental, the total harmonic content being about ten times larger. This
                       represents the greatest  disadvantage of  the quasi-square voltage-control
                       system, and normally limits the output voltage range to between 30%  and
                       90% of the d.c. supply, Le. a frequency change of 3:l in applications where
                       the voltage needs to be varied proportional to the frequency of  the load.
                         Figure 13.33 is also referred to as a single-pulse unidirectional wave. It is
                       unidirectional  since  in  any  half  cycle  the  output  is  either  positive  or
                       negative, but never both, and there is a single pulse in each half cycle. An
                       obvious extension to this system is shown in Figure 13.36, which illustrates