
Page 110 - Power Quality in Electrical Systems
P. 110
Power Harmonic Filters 93
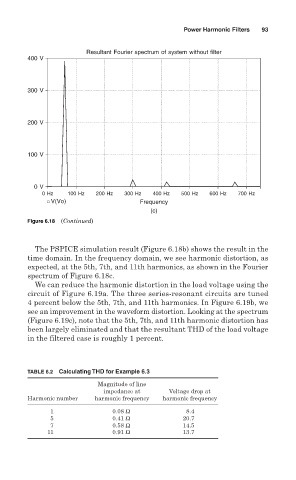
Resultant Fourier spectrum of system without filter
400 V
300 V
200 V
100 V
0 V
0 Hz 100 Hz 200 Hz 300 Hz 400 Hz 500 Hz 600 Hz 700 Hz
V(Vo) Frequency
(c)
Figure 6.18 (Continued)
The PSPICE simulation result (Figure 6.18b) shows the result in the
time domain. In the frequency domain, we see harmonic distortion, as
expected, at the 5th, 7th, and 11th harmonics, as shown in the Fourier
spectrum of Figure 6.18c.
We can reduce the harmonic distortion in the load voltage using the
circuit of Figure 6.19a. The three series-resonant circuits are tuned
4 percent below the 5th, 7th, and 11th harmonics. In Figure 6.19b, we
see an improvement in the waveform distortion. Looking at the spectrum
(Figure 6.19c), note that the 5th, 7th, and 11th harmonic distortion has
been largely eliminated and that the resultant THD of the load voltage
in the filtered case is roughly 1 percent.
TABLE 6.2 Calculating THD for Example 6.3
Magnitude of line
impedance at Voltage drop at
Harmonic number harmonic frequency harmonic frequency
1 0.08 Ω 8.4
5 0.41 Ω 20.7
7 0.58 Ω 14.5
11 0.91 Ω 13.7