
Page 186 - Power Quality in Electrical Systems
P. 186
168 Chapter Eleven
Resultant force due Force due to f on pole 2
on pole 1
Force due to f 1
Instantaneous force
to both poles
2
p p 3p 2p wt
2 2
1 cycle of supply frequency
Figure 11.17 Instantaneous and average force versus time for an AC
electromagnetic device with a shading coil [11.11].
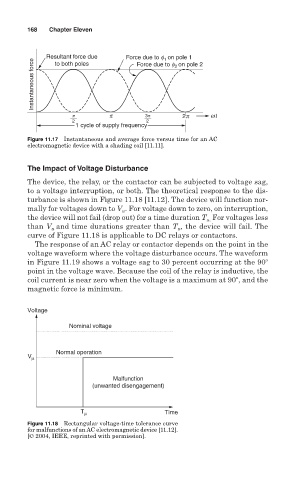
The Impact of Voltage Disturbance
The device, the relay, or the contactor can be subjected to voltage sag,
to a voltage interruption, or both. The theoretical response to the dis-
turbance is shown in Figure 11.18 [11.12]. The device will function nor-
mally for voltages down to V . For voltage down to zero, on interruption,
u
the device will not fail (drop out) for a time duration T For voltages less
u.
than V and time durations greater than T , the device will fail. The
u
u
curve of Figure 11.18 is applicable to DC relays or contactors.
The response of an AC relay or contactor depends on the point in the
voltage waveform where the voltage disturbance occurs. The waveform
in Figure 11.19 shows a voltage sag to 30 percent occurring at the 90
point in the voltage wave. Because the coil of the relay is inductive, the
coil current is near zero when the voltage is a maximum at 90 , and the
magnetic force is minimum.
Voltage
Nominal voltage
Normal operation
V µ
Malfunction
(unwanted disengagement)
T µ Time
Figure 11.18 Rectangular voltage-time tolerance curve
for malfunctions of an AC electromagnetic device [11.12].
[© 2004, IEEE, reprinted with permission].