
Page 187 - Power Quality in Electrical Systems
P. 187
Power Quality Events 169
250 V
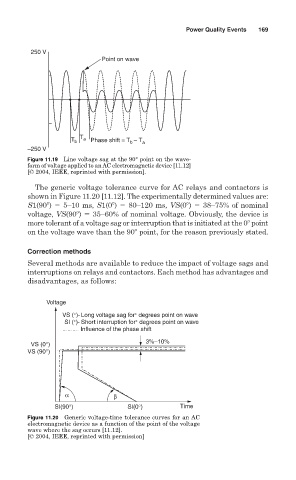
Point on wave
T b T a Phase shift = T – T a
b
–250 V
Figure 11.19 Line voltage sag at the 90° point on the wave-
form of voltage applied to an AC electromagnetic device [11.12]
[© 2004, IEEE, reprinted with permission].
The generic voltage tolerance curve for AC relays and contactors is
shown in Figure 11.20 [11.12]. The experimentally determined values are:
S1(90 ) 5–10 ms, S1(0 ) 80–120 ms, VS(0 ) 38–75% of nominal
voltage, VS(90 ) 35–60% of nominal voltage. Obviously, the device is
more tolerant of a voltage sag or interruption that is initiated at the 0 point
on the voltage wave than the 90 point, for the reason previously stated.
Correction methods
Several methods are available to reduce the impact of voltage sags and
interruptions on relays and contactors. Each method has advantages and
disadvantages, as follows:
Voltage
∗
∗
VS ( )- Long voltage sag for degrees point on wave
∗
∗
SI ( )- Short interruption for degrees point on wave
Influence of the phase shift
3%–10%
VS (0°)
VS (90°)
α β
SI(90°) SI(0°) Time
Figure 11.20 Generic voltage-time tolerance curves for an AC
electromagnetic device as a function of the point of the voltage
wave where the sag occurs [11.12].
[© 2004, IEEE, reprinted with permission]