
Page 35 - Power Quality in Electrical Systems
P. 35
18 Chapter Two
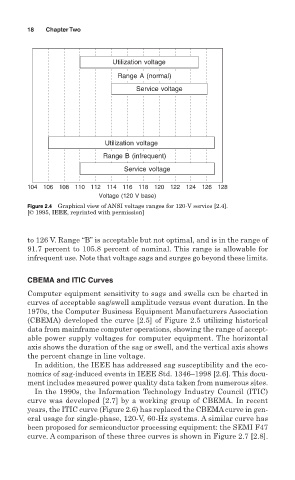
Utilization voltage
Range A (normal)
Service voltage
Utilization voltage
Range B (infrequent)
Service voltage
104 106 108 110 112 114 116 118 120 122 124 126 128
Voltage (120 V base)
Figure 2.4 Graphical view of ANSI voltage ranges for 120-V service [2.4].
[© 1995, IEEE, reprinted with permission]
to 126 V. Range “B” is acceptable but not optimal, and is in the range of
91.7 percent to 105.8 percent of nominal. This range is allowable for
infrequent use. Note that voltage sags and surges go beyond these limits.
CBEMA and ITIC Curves
Computer equipment sensitivity to sags and swells can be charted in
curves of acceptable sag/swell amplitude versus event duration. In the
1970s, the Computer Business Equipment Manufacturers Association
(CBEMA) developed the curve [2.5] of Figure 2.5 utilizing historical
data from mainframe computer operations, showing the range of accept-
able power supply voltages for computer equipment. The horizontal
axis shows the duration of the sag or swell, and the vertical axis shows
the percent change in line voltage.
In addition, the IEEE has addressed sag susceptibility and the eco-
nomics of sag-induced events in IEEE Std. 1346–1998 [2.6]. This docu-
ment includes measured power quality data taken from numerous sites.
In the 1990s, the Information Technology Industry Council (ITIC)
curve was developed [2.7] by a working group of CBEMA. In recent
years, the ITIC curve (Figure 2.6) has replaced the CBEMA curve in gen-
eral usage for single-phase, 120-V, 60-Hz systems. A similar curve has
been proposed for semiconductor processing equipment: the SEMI F47
curve. A comparison of these three curves is shown in Figure 2.7 [2.8].