
Page 36 - Power Quality in Electrical Systems
P. 36
Power-Quality Standards 19
250
200
Overvoltage condition
Percent change in bus voltage 100 0.5 cycle
150
50
Rated
Acceptable
8.33 ms Undervoltage conditions
−50 0 power supply voltage
−100
0.0001 0.001 0.01 0.1 1 10 100 1000
Time (sec)
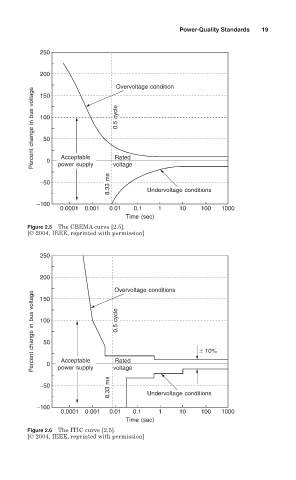
Figure 2.5 The CBEMA curve [2.5].
[© 2004, IEEE, reprinted with permission]
250
200
Overvoltage conditions
Percent change in bus voltage 100 0.5 cycle ± 10%
150
50
Acceptable
Rated
8.33 ms Undervoltage conditions
−50 0 power supply voltage
−100
0.0001 0.001 0.01 0.1 1 10 100 1000
Time (sec)
Figure 2.6 The ITIC curve [2.5].
[© 2004, IEEE, reprinted with permission]