
Page 43 - Power Quality in Electrical Systems
P. 43
26 Chapter Three
rms variation
120
100
Voltage (%) 80
60
40
20
0
0 0.05 0.1 0.15 0.2 0.25 0.3 0.35
Time (ms)
150
100
Voltage (%) −50 0
50
−100
−150
0 25 50 75 100 125 150 175 200
Time (ms)
2
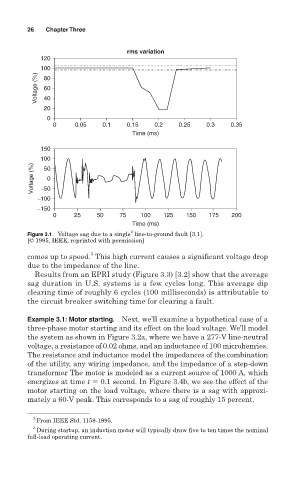
Figure 3.1 Voltage sag due to a single line-to-ground fault [3.1].
[© 1995, IEEE, reprinted with permission]
3
comes up to speed. This high current causes a significant voltage drop
due to the impedance of the line.
Results from an EPRI study (Figure 3.3) [3.2] show that the average
sag duration in U.S. systems is a few cycles long. This average dip
clearing time of roughly 6 cycles (100 milliseconds) is attributable to
the circuit breaker switching time for clearing a fault.
Example 3.1: Motor starting. Next, we’ll examine a hypothetical case of a
three-phase motor starting and its effect on the load voltage. We’ll model
the system as shown in Figure 3.2a, where we have a 277-V line-neutral
voltage, a resistance of 0.02 ohms, and an inductance of 100 microhenries.
The resistance and inductance model the impedances of the combination
of the utility, any wiring impedance, and the impedance of a step-down
transformer The motor is modeled as a current source of 1000 A, which
energizes at time t 0.1 second. In Figure 3.4b, we see the effect of the
motor starting on the load voltage, where there is a sag with approxi-
mately a 60-V peak. This corresponds to a sag of roughly 15 percent.
2
From IEEE Std. 1159-1995.
3
During startup, an induction motor will typically draw five to ten times the nominal
full-load operating current.