
Page 45 - Power Quality in Electrical Systems
P. 45
28 Chapter Three
200
180
160
Number of dips 120
140
100
80
60
40
20
0
0 5 10 15 20 25 60 Hr 30
0 5 10 15 20 50 Hr 25
Cycles
0 100 200 300 400 500
Dip duration, ms
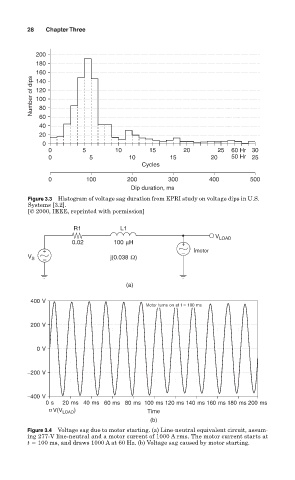
Figure 3.3 Histogram of voltage sag duration from EPRI study on voltage dips in U.S.
Systems [3.2].
[© 2000, IEEE, reprinted with permission]
R1 L1
V LOAD
0.02 100 µH +
+ − Imotor
V S − j(0.038 Ω)
(a)
400 V
Motor turns on at t = 100 ms
200 V
0 V
−200 V
−400 V
0 s 20 ms 40 ms 60 ms 80 ms 100 ms 120 ms 140 ms 160 ms 180 ms 200 ms
)
V(V LOAD Time
(b)
Figure 3.4 Voltage sag due to motor starting. (a) Line-neutral equivalent circuit, assum-
ing 277-V line-neutral and a motor current of 1000 A rms. The motor current starts at
t 100 ms, and draws 1000 A at 60 Hz. (b) Voltage sag caused by motor starting.