
Page 121 - Practical Control Engineering a Guide for Engineers, Managers, and Practitioners
P. 121
96 c•a .. ter folr
2
:8
e 1.5 .......
QJ
"0 t .. , .. ,.
.a
=
f 0.5 0 0 ••••••• • • •••• 0 ••••••••••
0
•••
•
0
0
to-3 t0-2 tOO
-90
-tOO
QJ
~ -110
-t20
-t30
to-3 to-2 to-1 tOO to 1
Frequency (/min)
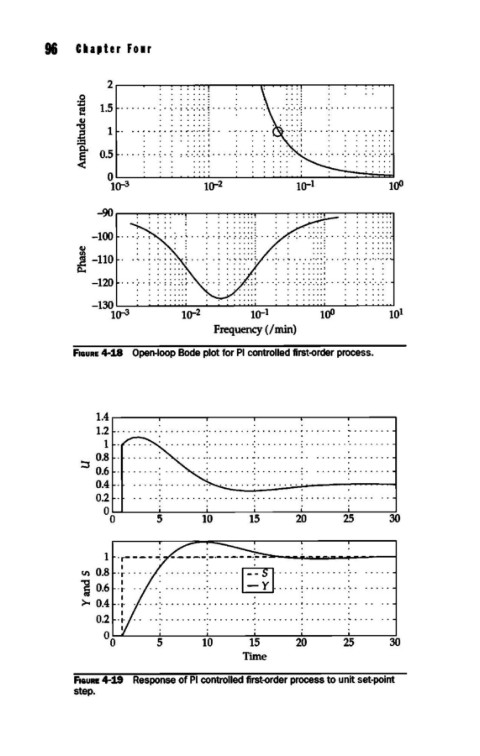
FIGURE 4-18 Open-loop Bode plot for PI controlled first-order process.
t.4 .-----.-------.-------..-----r------r------.
t.2
t ••••••••••••••••• • •••••••• 0 ~ 0 •••• 0 •••••••••••
0
•
•
:::s 0.8
0.6
0.4
.
0.2 • • . •••••••• •••••••• • •••••••• 0 . • 0 •• 0 • 0 0 : ••••
~
• •
0
0 o~--~5~--~t~o----~t~5----~2~o----~~~--~30
t ·r- ----:
i ~:: :~·::·:.: :::::::t::::l~~t::: i:::::::t
>c 0.4 I
tO t5 20 ~ 30
Time
FIGURE 4-:1.9 Response of PI controlled first-order process to unit set-point
step.