
Page 125 - Practical Control Engineering a Guide for Engineers, Managers, and Practitioners
P. 125
· · ·1- U (Control output) I
2 .......... .
1.8 .......... . . .I . -· Y (Process output)
. .
1.6 ..... , ..... , ..... , .... , .....
1.4
. .
:::s 1.2 •••• •t •••• •t •••• • • •••••
.....•.... ,_ _ _.........,. __________ ___.._----!
] 1
: ! . .
>- 0.8 : ..... : . ·! ... : ..... : . . . . . .......... .
• I
0.6 : ..... : . j ... : . . .. : ..... : ..... : . . ..
: i
0.4 ......... . : ••••• • •• J ••• ~ • • • • •• • • • • ~ •
0 • • • 0 •
• I
0.2 ......... . : ..... : . ~ ... : ..... : ..... : . . ....... .
: !
0 ~---------._:;·-·- ·-~-·... . . . . . . ' ..... : ..... ' .....
0 5 10 15 20 25 30 35 40
Time
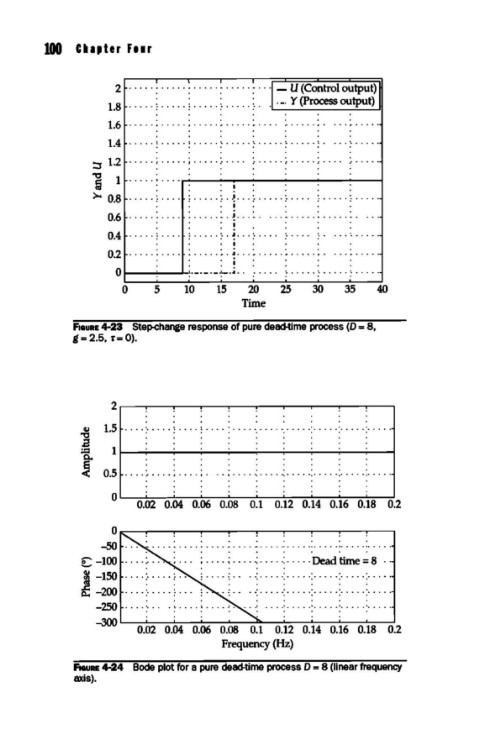
F1auRE 4-23 Step-change response of pure dead-time process (D = 8,
g = 2.5, 'r= 0).
] 1.5 ... -:· .... : .... : .... : .... · ..... · ..... ·:- ... -:· ... -:· ....
=
~ . . .
I
0
0
I
I
I
< 0.5 • •. •.• • • • • r • • •. r. . . , .................................. .
o~~~~~~~~-~-~~~----~----._~
0.02 0.04 0.06 0.08 0.1 0.12 0.14 0.16 0.18 0.2
0~-,----~----~-----r-----.-----r----,-----~----.---.
-50
£:-100 : · · · · ; · · · · .: · · · · .: · · · · ·Dead time = 8 · ·
. ·.· ... ·.· ... ·.· ... ·.· ... ·.· ....
I
I
I
0
I
J -150
~ -200 ............ . . ·.· ... ·.· ... ·.· ... ·.· ... ·.· ....
0
0
0
I
I
-250
~~~----~----~----~-------~----~----~----._~
0.02 0.04 0.06 0.08 0.1 0.12 0.14 0.16 0.18 0.2
Frequency (Hz)
F1auRE 4-24 Bode plot for a pure dead-time process D = 8 (linear frequency
axis).