
Page 129 - Practical Control Engineering a Guide for Engineers, Managers, and Practitioners
P. 129
104 Chapter Four
tot
(I)
"0
.a
:.= to 0
Q..
~
to-t
to-2 to-t
too
- 0
~
~ -tOO
.!
c..
-200
-300
to-2 tOO
Radian frequency
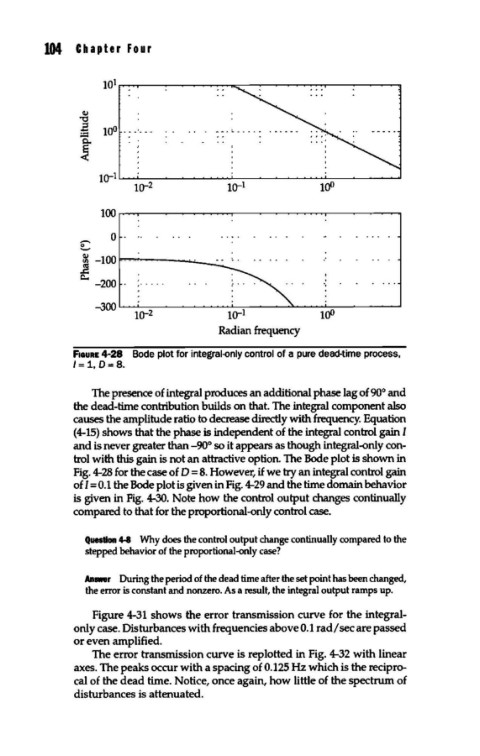
F1auRE 4-28 Bode plot for integral-only control of a pure dead-time process,
I= 1, 0=8.
The presence of integral produces an additional phase lag of 90° and
the dead-time contribution builds on that. The integral component also
causes the amplitude ratio to decrease directly with frequency. Equation
(4-tS) shows that the phase is independent of the integral control gain I
and is never greater than -90° so it appears as though integral-only con-
trol with this gain is not an attractive option. The Bode plot is shown in
Fig. 4-28 for the case of D = 8. However, if we try an integral control gain
of I= O.t the Bode plot is given in Fig. 4-29 and the time domain behavior
is given in Fig. 4-30. Note how the control output changes continually
compared to that for the proportional-only control case.
Question 4-8 Why does the control output change continually compared to the
stepped behavior of the proportional-only case?
Answer During the period of the dead time after the set point has been changed,
the error is constant and nonzero. As a result, the integral output ramps up.
Figure 4-3t shows the error transmission curve for the integral-
only case. Disturbances with frequencies above O.t rad/ sec are passed
or even amplified.
The error transmission curve is replotted in Fig. 4-32 with linear
axes. The peaks occur with a spacing of 0.125 Hz which is the recipro-
cal of the dead time. Notice, once again, how little of the spectrum of
disturbances is attenuated.