
Page 134 - Practical Control Engineering a Guide for Engineers, Managers, and Practitioners
P. 134
A New Domain and More Process Models 109
4·5·1 The Concept of Minimum Phase
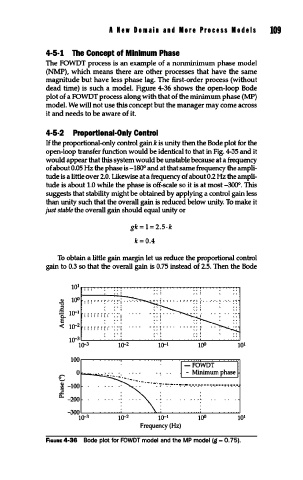
The FOWDT process is an example of a nonminimum phase model
(NMP), which means there are other processes that have the same
magnitude but have less phase lag. The first-order process (without
dead time) is such a model. Figure 4-36 shows the open-loop Bode
plot of a FOWDT process along with that of the minimum phase (MP)
model. We will not use this concept but the manager may come across
it and needs to be aware of it.
4·5·2 Proportional-Only Control
If the proportional-only control gain k is unity then the Bode plot for the
open-loop transfer function would be identical to that in Fig. 4-35 and it
would appear that this system would be unstable because at a frequency
of about 0.05 Hz the phase is -180° and at that same frequency the ampli-
tude is a little over 2.0. Likewise at a frequency of about 0.2 Hz the ampli-
tude is about 1.0 while the phase is off-scale so it is at most -300°. This
suggests that stability might be obtained by applying a control gain less
than unity such that the overall gain is reduced below unity. To make it
just stable the overall gain should equal unity or
gk= 1=2.5·k
k=0.4
To obtain a little gain margin let us reduce the proportional control
gain to 0.3 so that the overall gain is 0.75 instead of 2.5. Then the Bode
I r r r r r r ( ·: :· 1
'' j
:'I' 'I' 't''t':Ot".· ..... !
iii j j j i. j .... i
, .. ;
F1auRE 4-36 Bode plot for FOWDT model and the MP model (g = 0. 75).