
Page 135 - Practical Control Engineering a Guide for Engineers, Managers, and Practitioners
P. 135
110 Chapter Four
~ to-t • • r r r r ~ 1 1 i·)
.a
:.=
0..
~ to-2 r r r r r r P' I' I' ···£1
-
~
j -tOO
!:l. -200
-300~----~~----~~~--~~~~~~~~
to-3 to- 2 to-t tOO tot
Frequency (Hz)
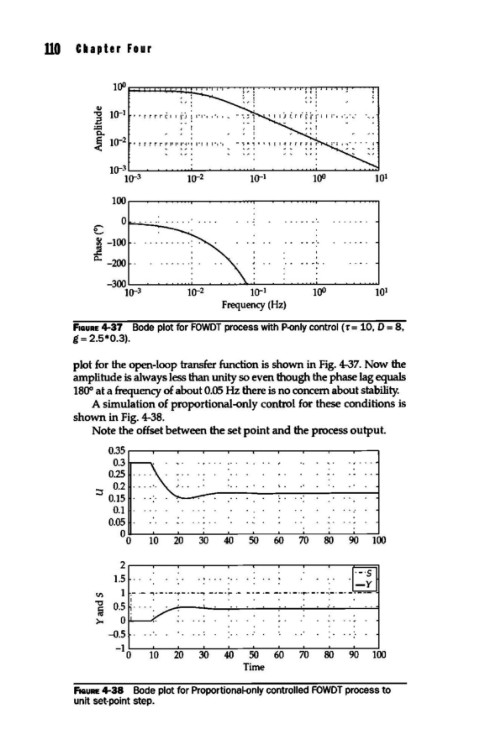
FIGURE 4-37 Bode plot for FOWDT process with P-only control (T= 10, D = 8,
g = 2.5*0.3).
plot for the open-loop transfer function is shown in Fig. 4-37. Now the
amplitude is always less than unity so even though the phase lag equals
1800 at a frequency of about 0.05 Hz there is no concern about stability.
A simulation of proportional-only control for these conditions is
shown in Fig. 4-38.
Note the offset between the set point and the process output.
0.35
0.3
0.25
::J 0.2
0.15
O.t
0.05
00 tO 20 30 40 50 60 70 80 90 tOO
2
1.5 . . . \ ... • .. . .
V)
"'0
;
>- 0
-0.5 ... . .. . .
-t
0 tO 20 30 40 50 60 70 80 90 tOO
Time
FIGURE 4-38 Bode plot for Proportional-only controlled FOWDT process to
unit set-point step.