Page 133 - Practical Control Engineering a Guide for Engineers, Managers, and Practitioners
P. 133

108  Chapter  Fonr


                    3r-~--.--.r--r---r==~========~~
                                               Y (Process response)
                                           0   -
                                             - U (Control output)
                                           0
                   2.5
                    2


                                                        0
                                  0
                    t           - -·-.- -·-. -·-·~·-·-·~"- -·-·-  ~ -·-
                                  ~
                   0.5

                    0 1----'----'
                     0           30  40   50   60   70   80   90  tOO
                                         Time
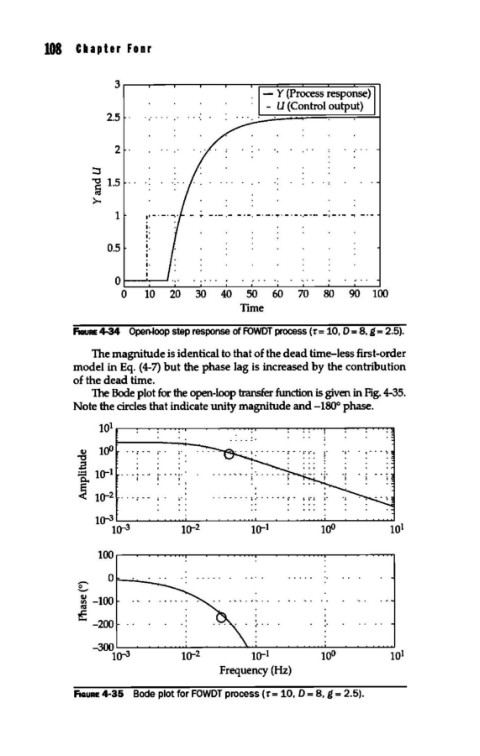
             fiGuRE 4-34  Open-loop step response of FOWDT process (T= 10, D  = 8, g  = 2.5).
                The magnitude is identical to that of the dead time-less first-order
             model in Eq. (4-7) but the phase lag is increased by the contribution
             of the dead time.
                The Bode plot for the open-loop transfer function is given in Fig. 4-35.
             Note the circles that indicate unity magnitude and -t80° phase.
                 t0 1 r-~~~~-----~~~---~~~-r---~~~~
                                       ......
              QJ  tOO                                  r
              "'tS
              .a
              :.=  to-1    r .. ·;·
              0..       i
                               0'
              ~ to-2                .. - - - - - '.· ... -- ;  -
                                           oO
                 to-Jto-J      to-2        to-1       tOO         101

                 too
              -    0
              ~
              ~-tOO
              cu
              f
                -200                       ....
                -300to-J       to-2        to-1       tOO         101
                                     Frequency (Hz)

             FIGURE 4-35  Bode plot for FOWDT process (T= 10, D  = 8, g  = 2.5).
   128   129   130   131   132   133   134   135   136   137   138