
Page 138 - Practical Control Engineering a Guide for Engineers, Managers, and Practitioners
P. 138
A New Do11ain and More Process Models ll3
~ ... · ...... , : . ... "· .. ""
to-I I I• •\<o\• • • •• • .- ;-"'",
........
to-2~~~--~~~~~~~~~--~~~~~~~
to-4 to-3 to-2 to-t tOO tot
Frequency (Hz)
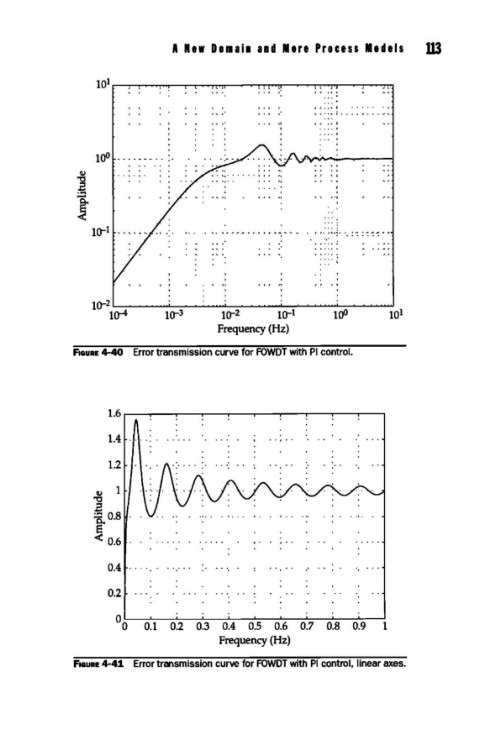
FIGURE 4-40 Error transmission curve for FOWDT with PI control.
1.4
1.2
1
~
.a
:s._o.s
e
< 0.6
0.4
0.2
0
o 0.1 0.2 0.3 0.4 0.5 0.6 0.7 0.8 0.9 1
Frequency (Hz)
FIGURE 4-41 Error transmission curve for FOWDT with PI control, linear axes.