
Page 142 - Practical Control Engineering a Guide for Engineers, Managers, and Practitioners
P. 142
A New Do11ain and lore Process Models 117
1
2
~(-rmc) + 1
(4-26)
1
-m,D- tan- (-rmJ = -n
Equation (4-26) gives two equations in two unknowns: k, and m,.
A closed form solution to this problem is not straightforward (and
probably not possible, at least for me) so a numerical solution based
on a two-dimensional minimization (using fminsearch in Matlab)
yielded the following values for g = 2.5, 'f = 10, D = 8, k, = 1.06, fc =
0.039. Had we tried the same approach for PI control there would still
be two equations but now there would be three unknowns.
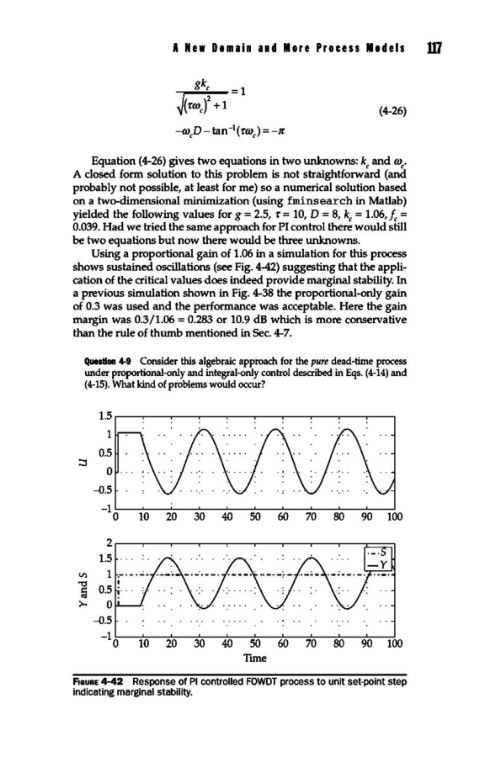
Using a proportional gain of 1.06 in a simulation for this process
shows sustained oscillations (see Fig. 4-42) suggesting that the appli-
cation of the critical values does indeed provide marginal stability. In
a previous simulation shown in Fig. 4-38 the proportional-only gain
of 0.3 was used and the performance was acceptable. Here the gain
margin was 0.3/1.06 = 0.283 or 10.9 dB which is more conservative
than the rule of thumb mentioned in Sec. 4-7.
Question 4-9 Consider this algebraic approach for the pure dead-time process
under proportional-only and integral-only control described in Eqs. (4-14) and
(4-15). What kind of problems would occur?
1.5
1
0.5
::::::1
0
-0.5
10 20 30 40 50 60 70 80 90 100
2
1.5
U')
"'0
ij
>o 0
-0.5 . . . . .... .. . ...
-1
0 10 20 30 40 50 60 70 80 90 100
Tune
fiGURE 4-42 Response of PI controlled FOWDT process to unit set-point step
indicating marginal stability.