
Page 166 - Practical Control Engineering a Guide for Engineers, Managers, and Practitioners
P. 166
Matrices and Higher-Order Process Models 141
the single-tank process. The next curve on the right is for N = 2 and
the response reaches a value of 0.63 at about t = 2. Note that as N
increases the response curves take on a sharper inflection and the
time at which the process output passes the value of 0.63 increases.
For large N, the process appears to have a significant dead time even
though there is no explicit dead time in the model.
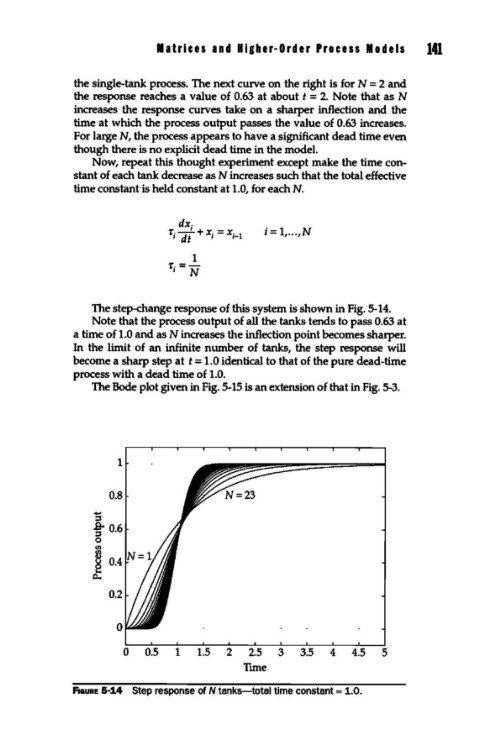
Now, repeat this thought experiment except make the time con-
stant of each tank decrease as N increases such that the total effective
time constant is held constant at 1.0, for each N.
dx.
1
T--+x. =x. i = 1, ... ,N
I df I 1- 1
1
T-=-
1 N
The step-change response of this system is shown in Fig. 5-14.
Note that the process output of all the tanks tends to pass 0.63 at
a time of 1.0 and as N increases the inflection point becomes sharper.
In the limit of an infinite number of tanks, the step response will
become a sharp step at t = 1.0 identical to that of the pure dead-time
process with a dead time of 1.0.
The Bode plot given in Fig. 5-15 is an extension of that in Fig. 5-3.
1
0.8
.....
=
t 0.6
<I)
~
2 o.4
Q..,
0.2
0
0 0.5 1 1.5 2 2.5 3 3.5 4 4.5 5
Tune
F1auRE 5-14 Step response of N tanks-total time constant= 1.0.