
Page 194 - Practical Control Engineering a Guide for Engineers, Managers, and Practitioners
P. 194
168 Chapter Six
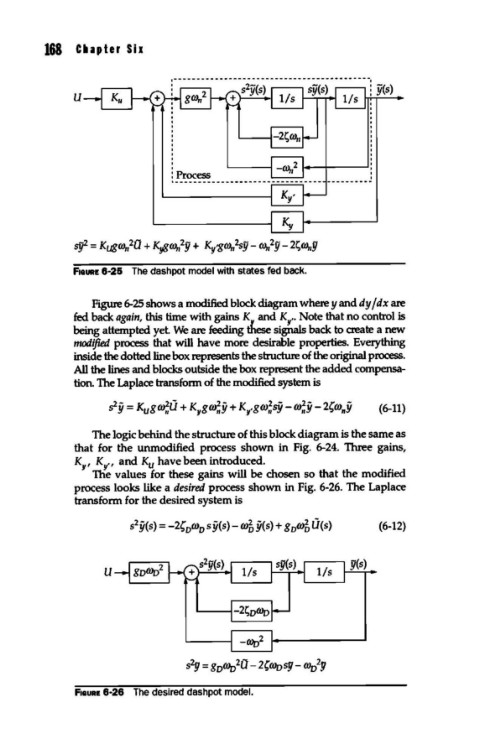
FIGURE 6-25 The dashpot model with states fed back.
Figure 6-25 shows a modified block diagram where y and dy fdx are
fed back again, this time with gains ~Y and KY .. Note that no control is
being attempted yet. We are feeding these sigltals back to create a new
modified process that will have more desirable properties. Everything
inside the dotted line box represents the structure of the original process.
All the lines and blocks outside the box represent the added compensa-
tion. The Laplace transform of the modified system is
(6-11)
The logic behind the structure of this block diagram is the same as
that for the unmodified process shown in Fig. 6-24. Three gains,
K:v, K:v', and Ku have been introduced.
The values for these gains will be chosen so that the modified
process looks like a desired process shown in Fig. 6-26. The Laplace
transform for the desired system is
u
FIGURE 6-26 The desired dashpot model.