
Page 31 - Practical Control Engineering a Guide for Engineers, Managers, and Practitioners
P. 31
6 Cha11ter 01e
8 01--~
~
·ut -0.2
0
~ -0.4
> ....
ca -0.6 • , •••••••• 0
>
·~ -0.8
Q -1 j I i I
0 10 20 30 40 50 60 70 80 90 100
Tl.ll\e
0
-0.2 0 ..........
] -0.4
~ -0.6
~ -0.8
-1
0 10 20 30 40 50 60 70 80 90 100
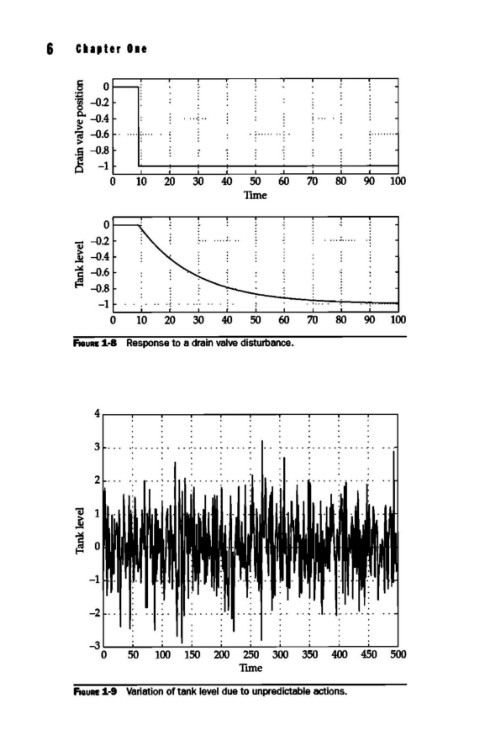
FIGURE 1.-8 Response to a drain valve disturbance.
4~--~--~--~--~--~--~---,----~--~~
-3~--._--~--~--~--~--~--~----~--._~
0 50 100 150 200 250 300 350 400 450 500
Tl.ll\e
F1auRE 1.-9 variation of tank level due to unpredictable actions.