
Page 214 - Principles of Applied Reservoir Simulation 2E
P. 214
Part III: Case Study 199
Table 20-1
Well Log Analysis Summary
Lithology Depth (ft) to s w h NTG
*
(From Top of (fr.) (fr.) (ft) (fr.)
Cuttings) Formation
Sandstone 9330 0.20 0.30 80 0.9
Shale 9410 — — 20 —
Sandstone with 9430 0.25 0.30 120 0.8
Shale Stringer
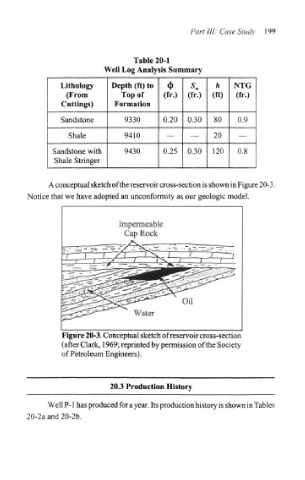
A conceptual sketch of the reservoir cross-section is shown in Figure 20-3,
Notice that we have adopted an unconformity as our geologic model.
Impermeable
Cap Rock
Oil
Water
Figure 20-3. Conceptual sketch of reservoir cross-section
(after Clark, 1969; reprinted by permission of the Society
of Petroleum Engineers).
20.3 Production History
Well P-1 has produced for a year. Its production history is shown in Tables
20-2a and 20-2b.