
Page 219 - Principles of Applied Reservoir Simulation 2E
P. 219
204 Principles of Applied Reservoir Simulation
Initial reservoir pressure was estimated from the DST to be 3936 psia at
a depth of 9360 ft below sea level. This pressure is over 1400 psia greater than
the laboratory measured bubble point pressure of 2514 psia. Table 20-6 presents
fluid properties for undersaturated oil that must be corrected for use in a reservoi r
simulator,
20.5.1 Black Oil PVT Correction
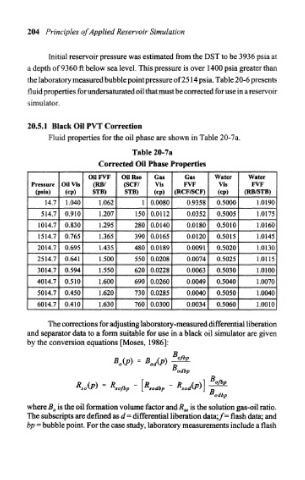
Fluid properties for the oil phase are shown in Table 20-7a.
Table 20-7a
Corrected Oil Phase Properties
OUFVF OilRso Gas Gas Water Water
Pressure Oil Vis (KB/ (SCF/ Vis FVF Vis FVF
(psia) (cp) STB) STB) (cp) (RCF/SCF) (cp) (RB/STB)
14.7 1.040 1.062 1 0.0080 0.9358 0.5000 1.0190
514.7 0.910 1.207 150 0.0112 0.0352 0.5005 1.0175
1014.7 0.830 1.295 280 0.0140 0.0180 0.5010 1.0160
1514.7 0.765 1.365 390 0.0165 0.0120 0.5015 1.0145
2014.7 0.695 1.435 480 0.0189 0.0091 0.5020 1.0130
2514.7 0.641 1.500 550 0.0208 0.0074 0.5025 1.0115
3014.7 0.594 1.550 620 0.0228 0.0063 0.5030 1.0100
4014.7 0.510 1.600 690 0.0260 0.0049 0.5040 1.0070
5014.7 0.450 1.620 730 0.0285 0.0040 0.5050 1.0040
6014.7 0.410 1.630 760 0.0300 0.0034 0.5060 1.0010
The corrections for adjusting laboratory-measured differential liberation
and separator data to a form suitable for use in a black oil simulator are given
by the conversion equations [Moses, 1986]:
B
R = R R R
so(P) sofbp ~ [ sodbp - *od(P)\ ~ -
"odbp
where B 0 is the oil formation volume factor and R^ is the solution gas-oil ratio.
The subscripts are defined as d = differential liberation data;/= flash data; and
bp = bubble point. For the case study, laboratory measurements include a flash