
Page 217 - Principles of Applied Reservoir Simulation 2E
P. 217
202 Principles of Applied Reservoir Simulation
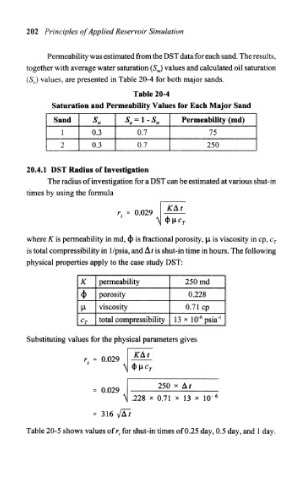
Permeability was estimated from the DST data for each sand. The results,
together with average water saturation (5 W ) values and calculated oil saturation
(S 0) values, are presented in Table 20-4 for both major sands.
Table 20-4
Saturation and Permeability Values for Each Major Sand
Sand s» S. = 1-S W Permeability (nnd)
! 0.3 0.7 75
2 0.3 0.7 250
20.4.1 DST Radius of Investigation
The radius of investigation for a DST can be estimated at various shut-in
times by using the formula
f CAr
r. - 0.029
N <i> »C T
where K is permeability in md, <j> is fractional porosity, |l is viscosity in cp, C T
is total compressibility in 1/psia, and Ads shut-in time in hours. The following
physical properties apply to the case study DST:
K permeability 250 md
<t> porosity 0.228
M- viscosity 0.71 cp
total compressibility 13 x lO^psia 1
C T
Substituting values for the physical parameters gives
Kkt
r. = 0.029
N 4>Hc r
250 x Af
0.02y
^ .228 x 0.71 x 13 x 1Q~ 6
= 316
Table 20-5 shows values of r i for shut-in times of 0.25 day, 0.5 day, and 1 day.