
Page 216 - Principles of Applied Reservoir Simulation 2E
P. 216
Part III: Case Studv 201
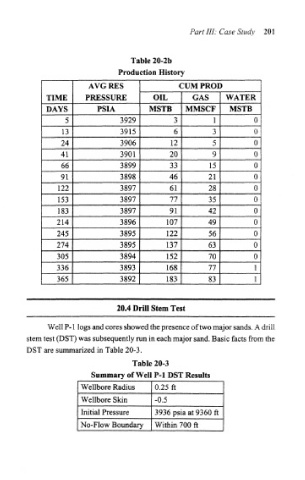
Table 20-2b
Production History
AVGRES CUM PROD
TIME PRESSURE OIL GAS WATER
DAYS PSIA MSTB MMSCF MSTB
5 3929 3 1 0
13 3915 6 3 0
24 3906 12 5 0
41 3901 20 9 0
66 3899 33 15 0
91 3898 46 21 0
122 3897 61 28 0
153 3897 77 35 0
183 3897 91 42 0
214 3896 107 49 0
245 3895 122 56 0
274 3895 137 63 0
305 3894 152 70 0
336 3893 168 77 1
365 3892 183 83 1
20.4 Drill Stem Test
Well P-l logs and cores showed the presence of two major sands. A drill
stem test (DST) was subsequently run in each major sand. Basic facts from the
DST are summarized in Table 20-3.
Table 20-3
Summary of Well P-l DST Results
Wellbore Radius 0.25 ft
Wellbore Skin -0.5
Initial Pressure 3936 psia at 9360 ft
No-Flow Boundary Within 700 ft