
Page 218 - Principles of Applied Reservoir Simulation 2E
P. 218
Part III: Case Study 203
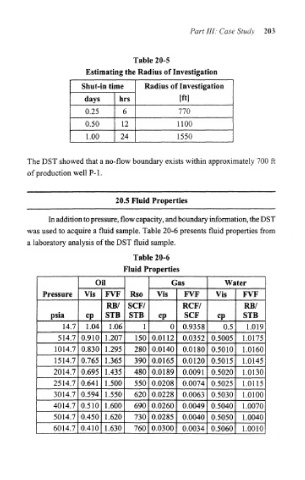
Table 20-5
Estimating the Radius of Investigation
Shut-in time Radius of Investigation
days hrs [ft]
0.25 6 770
0.50 12 1100
1.00 24 1550
The DST showed that a no-flow boundary exists within approximately 700 ft
of production well P-l.
20.5 Fluid Properties
In addition to pressure, flow capacity, and boundary information, the DST
was used to acquire a fluid sample. Table 20-6 presents fluid properties from
a laboratory analysis of the DST fluid sample.
Table 20-6
Fluid Properties
Oil Gas Water
Pressure Vis FVF Rso Vis FVF Vis FVF
RB/ SCF/ RCF/ RB/
psia cp STB STB cp SCF cp STB
14.7 1.04 1.06 1 0 0.9358 0.5 1.019
514.7 0.910 1.207 150 0.0112 0.0352 0.5005 1.0175
1014.7 0.830 1.295 280 0.0140 0.0180 0.5010 1.0160
1514.7 0.765 1.365 390 0.0165 0.0120 0.5015 1.0145
2014,7 0.695 1.435 480 0.0189 0.0091 0.5020 1.0130
2514.7 0.641 1.500 550 0.0208 0.0074 0.5025 1.0115
3014.7 0.594 1.550 620 0.0228 0.0063 0.5030 1.0100
4014.7 0.510 1.600 690 0.0260 0.0049 0.5040 1.0070
5014.7 0.450 1.620 730 0.0285 0.0040 0.5050 1.0040
6014.7 0.410 1.630 760 0.0300 0.0034 0.5060 1.0010