
Page 215 - Principles of Applied Reservoir Simulation 2E
P. 215
200 Principles of Applied Reservoir Simulation
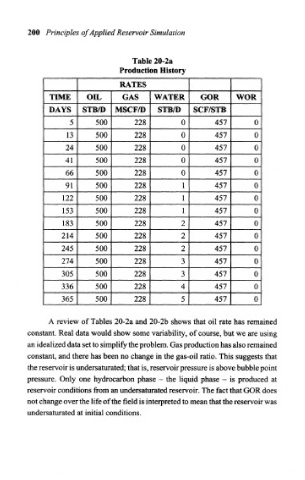
Table 20-2a
Production History
RATES
TIME OIL GAS WATER GOR WOR
DAYS STB/D MSCF/D STB/D SCF/STB
5 500 228 0 457 0
13 500 228 0 457 0
24 500 228 0 457 0
41 500 228 0 457 0
66 500 228 0 457 0
91 500 228 1 457 0
122 500 228 1 457 0
153 500 228 1 457 0
183 500 228 2 457 0
214 500 228 2 457 0
245 500 228 2 457 0
274 500 228 3 457 0
305 500 228 3 457 0
336 500 228 4 457 0
365 500 228 5 457 0
A review of Tables 20-2a and 20-2b shows that oil rate has remained
constant. Real data would show some variability, of course, but we are using
an idealized data set to simplify the problem. Gas production has also remained
constant, and there has been no change in the gas-oil ratio. This suggests that
the reservoir is undersaturated; that is, reservoir pressure is above bubble point
pressure. Only one hydrocarbon phase - the liquid phase - is produced at
reservoir conditions from an undersaturated reservoir. The fact that GOR does
not change over the life of the field is interpreted to mean that the reservoir was
undersaturated at initial conditions.