
Page 169 - Probability Demystified
P. 169
158 CHAPTER 9 The Normal Distribution
EXAMPLE: According to a study by A.C. Neilson, children between 2 and 5
years of age watch an average of 25 hours of television per week. Assume the
variable is approximately normally distributed with a standard deviation
of 2. If a child is selected at random, find the probability that the child
watched more than 27 hours of television per week.
SOLUTION:
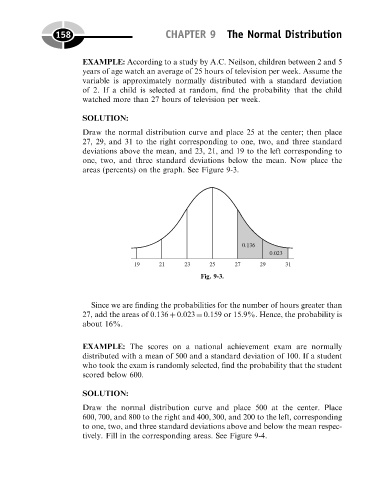
Draw the normal distribution curve and place 25 at the center; then place
27, 29, and 31 to the right corresponding to one, two, and three standard
deviations above the mean, and 23, 21, and 19 to the left corresponding to
one, two, and three standard deviations below the mean. Now place the
areas (percents) on the graph. See Figure 9-3.
Fig. 9-3.
Since we are finding the probabilities for the number of hours greater than
27, add the areas of 0.136 þ 0.023 ¼ 0.159 or 15.9%. Hence, the probability is
about 16%.
EXAMPLE: The scores on a national achievement exam are normally
distributed with a mean of 500 and a standard deviation of 100. If a student
who took the exam is randomly selected, find the probability that the student
scored below 600.
SOLUTION:
Draw the normal distribution curve and place 500 at the center. Place
600, 700, and 800 to the right and 400, 300, and 200 to the left, corresponding
to one, two, and three standard deviations above and below the mean respec-
tively. Fill in the corresponding areas. See Figure 9-4.