
Page 172 - Probability Demystified
P. 172
CHAPTER 9 The Normal Distribution 161
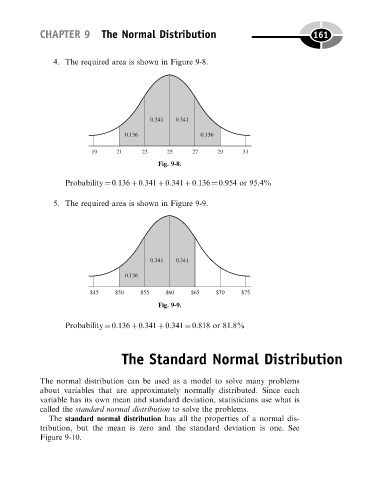
4. The required area is shown in Figure 9-8.
Fig. 9-8.
Probability ¼ 0.136 þ 0.341 þ 0.341 þ 0.136 ¼ 0.954 or 95.4%
5. The required area is shown in Figure 9-9.
Fig. 9-9.
Probability ¼ 0.136 þ 0.341 þ 0.341 ¼ 0.818 or 81.8%
The Standard Normal Distribution
The normal distribution can be used as a model to solve many problems
about variables that are approximately normally distributed. Since each
variable has its own mean and standard deviation, statisticians use what is
called the standard normal distribution to solve the problems.
The standard normal distribution has all the properties of a normal dis-
tribution, but the mean is zero and the standard deviation is one. See
Figure 9-10.