
Page 176 - Probability Demystified
P. 176
CHAPTER 9 The Normal Distribution 165
To find the area under the standard normal distribution curve between any
given two z values, look up the areas in Table 9-1 and subtract the smaller
area from the larger. In this case the area corresponding to z ¼ 1.6 is 0.055,
and the area corresponding to z ¼ 0.8 is 0.788, so the area between z ¼ 1.6
and z ¼ 0.8 is 0.788 0.055 ¼ 0.733 ¼ 73.3%. In other words, 73.3% of the
area under the standard normal distribution curve is between z ¼ 1.6 and
z ¼ 0.8.
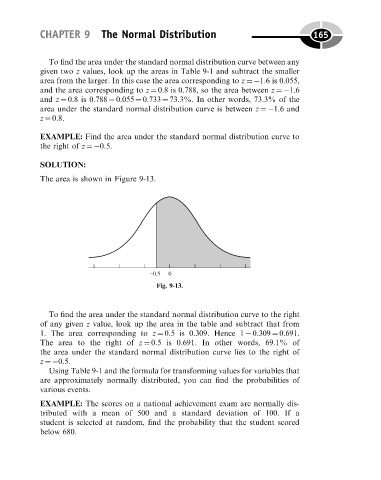
EXAMPLE: Find the area under the standard normal distribution curve to
the right of z ¼ 0.5.
SOLUTION:
The area is shown in Figure 9-13.
Fig. 9-13.
To find the area under the standard normal distribution curve to the right
of any given z value, look up the area in the table and subtract that from
1. The area corresponding to z ¼ 0.5 is 0.309. Hence 1 0.309 ¼ 0.691.
The area to the right of z ¼ 0.5 is 0.691. In other words, 69.1% of
the area under the standard normal distribution curve lies to the right of
z ¼ 0.5.
Using Table 9-1 and the formula for transforming values for variables that
are approximately normally distributed, you can find the probabilities of
various events.
EXAMPLE: The scores on a national achievement exam are normally dis-
tributed with a mean of 500 and a standard deviation of 100. If a
student is selected at random, find the probability that the student scored
below 680.