
Page 175 - Probability Demystified
P. 175
164 CHAPTER 9 The Normal Distribution
This table gives the approximate cumulative areas for z values between
3 and þ3. The next three examples will show how to find the area (and
corresponding probability in decimal form).
EXAMPLE: Find the area under the standard normal distribution curve to
the left of z ¼ 1.3.
SOLUTION:
The area is shown in Figure 9-11.
Fig. 9-11.
In order to find the area under the standard normal distribution curve to
the left of any given z value, just look it up directly in Table 9-1. The area is
0.903 or 90.3%.
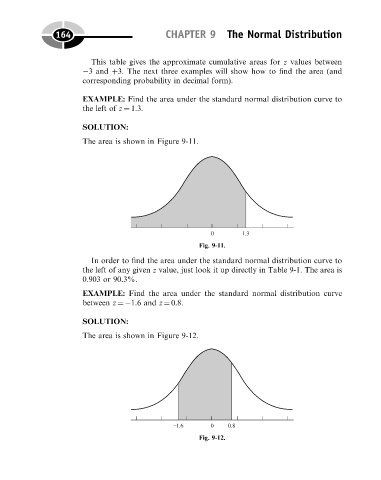
EXAMPLE: Find the area under the standard normal distribution curve
between z ¼ 1.6 and z ¼ 0.8.
SOLUTION:
The area is shown in Figure 9-12.
Fig. 9-12.