
Page 174 - Probability Demystified
P. 174
CHAPTER 9 The Normal Distribution 163
can be found by converting them to z values and using the standard normal
distribution.
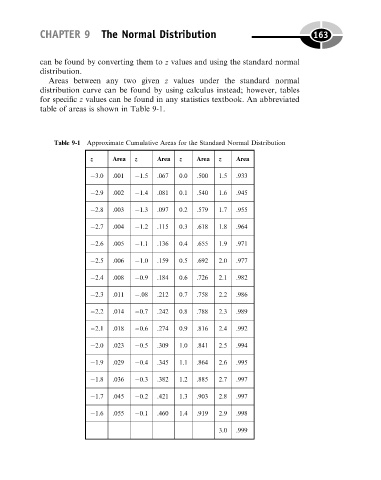
Areas between any two given z values under the standard normal
distribution curve can be found by using calculus instead; however, tables
for specific z values can be found in any statistics textbook. An abbreviated
table of areas is shown in Table 9-1.
Table 9-1 Approximate Cumulative Areas for the Standard Normal Distribution
z Area z Area z Area z Area
3.0 .001 1.5 .067 0.0 .500 1.5 .933
2.9 .002 1.4 .081 0.1 .540 1.6 .945
2.8 .003 1.3 .097 0.2 .579 1.7 .955
2.7 .004 1.2 .115 0.3 .618 1.8 .964
2.6 .005 1.1 .136 0.4 .655 1.9 .971
2.5 .006 1.0 .159 0.5 .692 2.0 .977
2.4 .008 0.9 .184 0.6 .726 2.1 .982
2.3 .011 .08 .212 0.7 .758 2.2 .986
2.2 .014 0.7 .242 0.8 .788 2.3 .989
2.1 .018 0.6 .274 0.9 .816 2.4 .992
2.0 .023 0.5 .309 1.0 .841 2.5 .994
1.9 .029 0.4 .345 1.1 .864 2.6 .995
1.8 .036 0.3 .382 1.2 .885 2.7 .997
1.7 .045 0.2 .421 1.3 .903 2.8 .997
1.6 .055 0.1 .460 1.4 .919 2.9 .998
3.0 .999