
Page 65 - Probability and Statistical Inference
P. 65
42 1. Notions of Probability
The Gamma Distribution: The expression Γ(α) was introduced in
(1.6.19). We say that a positive continuous random variable X has the gamma
distribution involving α and β, denoted by Gamma(α, β), if and only if its pdf
is given by
where 0 < α, β < ∞. Here, α and β are referred to as parameters. By varying
the values of α and β, one can generate interesting shapes for the associated
pdf.
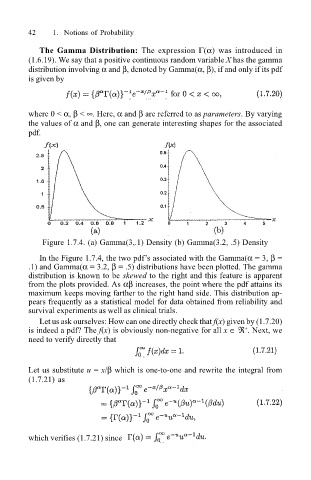
Figure 1.7.4. (a) Gamma(3,.1) Density (b) Gamma(3.2, .5) Density
In the Figure 1.7.4, the two pdfs associated with the Gamma(α = 3, β =
.1) and Gamma(α = 3.2, β = .5) distributions have been plotted. The gamma
distribution is known to be skewed to the right and this feature is apparent
from the plots provided. As αβ increases, the point where the pdf attains its
maximum keeps moving farther to the right hand side. This distribution ap-
pears frequently as a statistical model for data obtained from reliability and
survival experiments as well as clinical trials.
Let us ask ourselves: How can one directly check that f(x) given by (1.7.20)
+
is indeed a pdf? The f(x) is obviously non-negative for all x ∈ ℜ . Next, we
need to verify directly that
Let us substitute u = x/β which is one-to-one and rewrite the integral from
(1.7.21) as
which verifies (1.7.21) since