
Page 159 - Process Equipment and Plant Design Principles and Practices by Subhabrata Ray Gargi Das
P. 159
156 Chapter 5 Heat exchanger network analysis
Table P5.4A Stream specification table.
TS [ TT [
TSLðDT min =2Þ TTLðDT min =2Þ
for hot stream for hot stream
TS [ TT [
CP TSLðDT min =2Þ TTDðDT min =2Þ
Stream TS TT (kW/ for cold stream for cold stream
no. Type ( C) ( C) C) DH(kW) ( C) ( C)
1 Hot 170 60 2.5 275 165 55
2 Hot 150 30 1 240 145 25
3 Cold 20 135 1.5 172.5 25 140
4 Cold 80 140 4 280 85 145
Hot and cold utilities are available at temperatures above the highest and the lowest temperatures in the process.
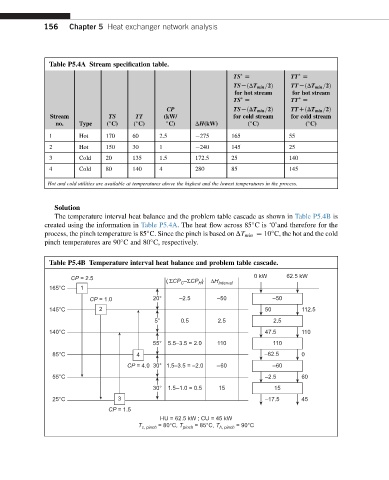
Solution
The temperature interval heat balance and the problem table cascade as shown in Table P5.4B is
created using the information in Table P5.4A. The heat flow across 85 C is ‘0’and therefore for the
process, the pinch temperature is 85 C. Since the pinch is based on DT min ¼ 10 C, the hot and the cold
pinch temperatures are 90 C and 80 C, respectively.
Table P5.4B Temperature interval heat balance and problem table cascade.
CP = 2.5 0 kW 62.5 kW
( ΣCP –ΣCP ) ΔH Interval
C
H
165°C 1
CP = 1.0 20° –2.5 –50 –50
145°C 2 50 112.5
5° 0.5 2.5 2.5
140°C 47.5 110
55° 5.5–3.5 = 2.0 110 110
85°C 4 –62.5 0
CP = 4.0 30° 1.5–3.5 = –2.0 –60 –60
55°C –2.5 60
30° 1.5–1.0 = 0.5 15 15
25°C 3 –17.5 45
CP = 1.5
HU = 62.5 kW ; CU = 45 kW
T c, pinch = 80°C, T pinch = 85°C, T h, pinch = 90°C