
Page 155 - Process Equipment and Plant Design Principles and Practices by Subhabrata Ray Gargi Das
P. 155
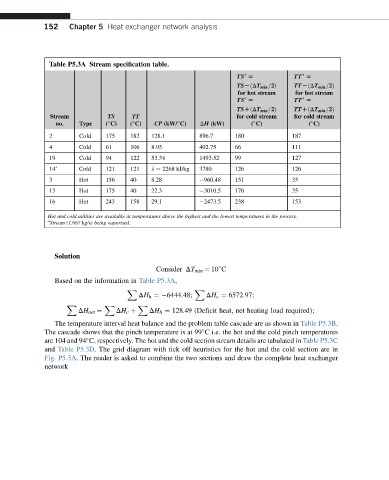
152    Chapter 5 Heat exchanger network analysis


               Table P5.3A Stream specification table.
                                                                   TS [           TT [


                                                                   TSLðDT min =2Þ  TTLðDT min =2Þ
                                                                   for hot stream  for hot stream
                                                                   TS [           TT [


                                                                   TSDðDT min =2Þ  TTDðDT min =2Þ
               Stream          TS     TT                           for cold stream  for cold stream
                no.    Type   ( C)   ( C)   CP (kW/ C)  DH (kW)        ( C)            ( C)


               2       Cold   175    182   128.1        896.7     180             187
               4       Cold   61     106   8.95         402.75    66              111
               19      Cold   94     122   53.34        1493.52   99              127
               14 a    Cold   121    121   l ¼ 2268 kJ/kg  3780   126             126
               3       Hot    156    40    8.28          960.48   151             35
               13      Hot    175    40    22.3          3010.5   170             35
               16      Hot    243    158   29.1          2473.5   238             153
              Hot and cold utilities are available at temperatures above the highest and the lowest temperatures in the process.
              a
               Stream (1.667 kg/s) being vaporised.


                Solution
                                            Consider DT min ¼ 10 C

                Based on the information in Table P5.3A,
                                    X                  X
                                       DH h ¼ 6444.48;    DH c ¼ 6572.97;
                    X         X        X
                                          DH h ¼ 128.49 ðDeficit heat; net heating load requiredÞ;
                       DH net ¼  DH c þ
                The temperature interval heat balance and the problem table cascade are as shown in Table P5.3B.
             The cascade shows that the pinch temperature is at 99 C i.e. the hot and the cold pinch temperatures

             are 104 and 94 C, respectively. The hot and the cold section stream details are tabulated in Table P5.3C

             and Table P5.3D. The grid diagram with tick off heuristics for the hot and the cold section are in
             Fig. P5.3A. The reader is asked to combine the two sections and draw the complete heat exchanger
             network